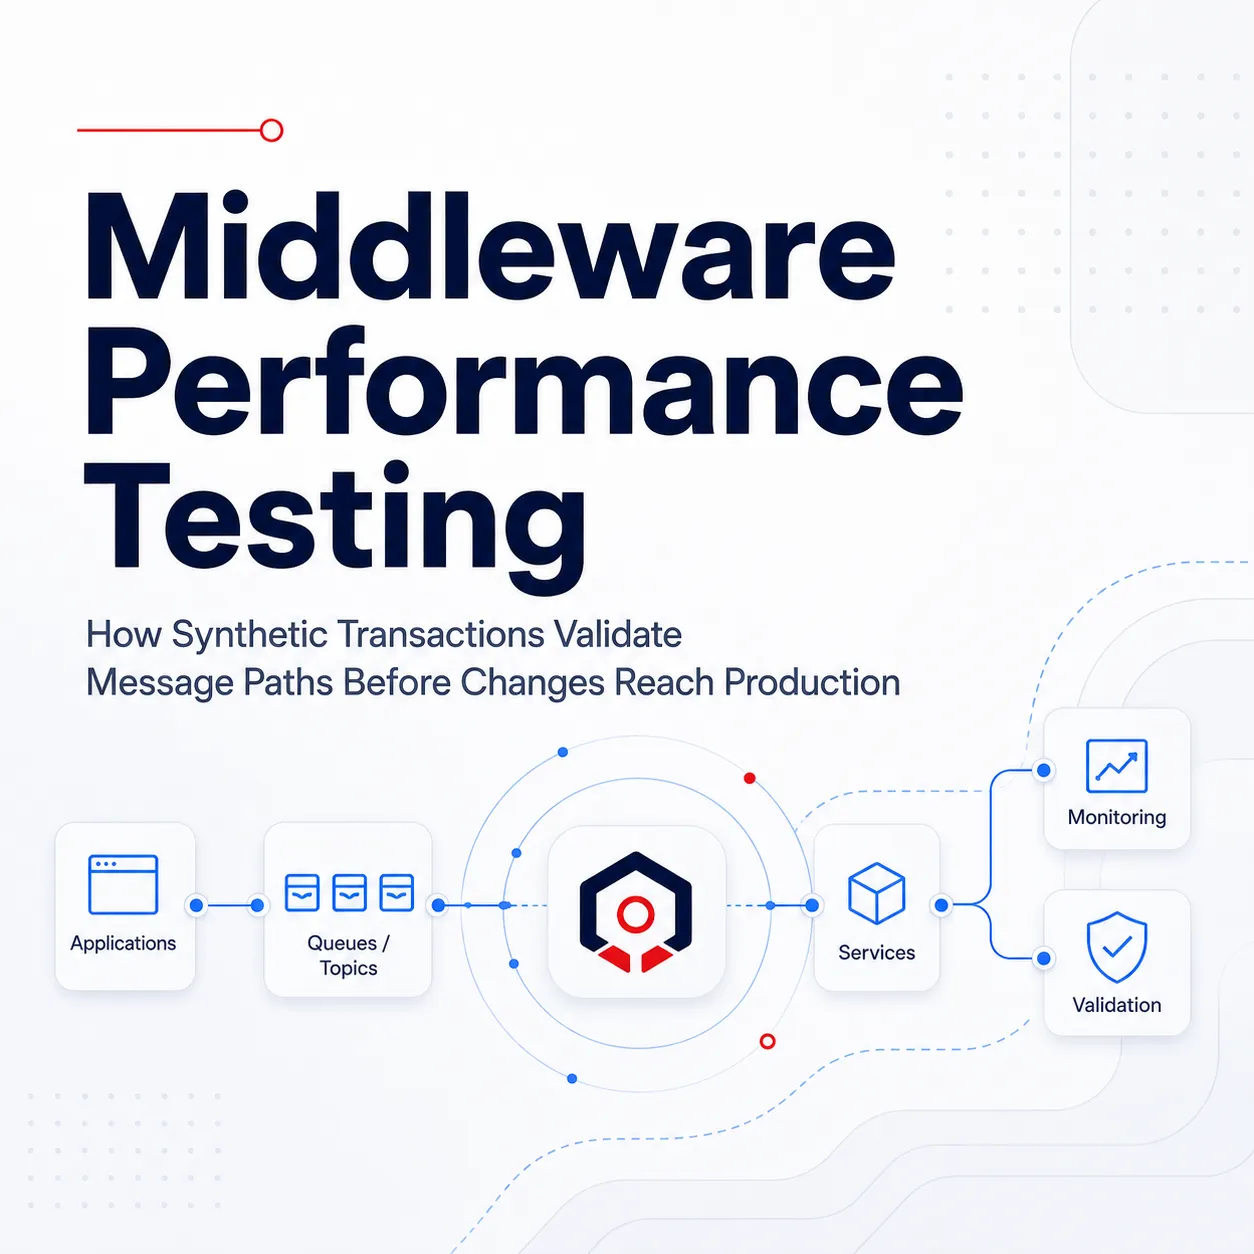
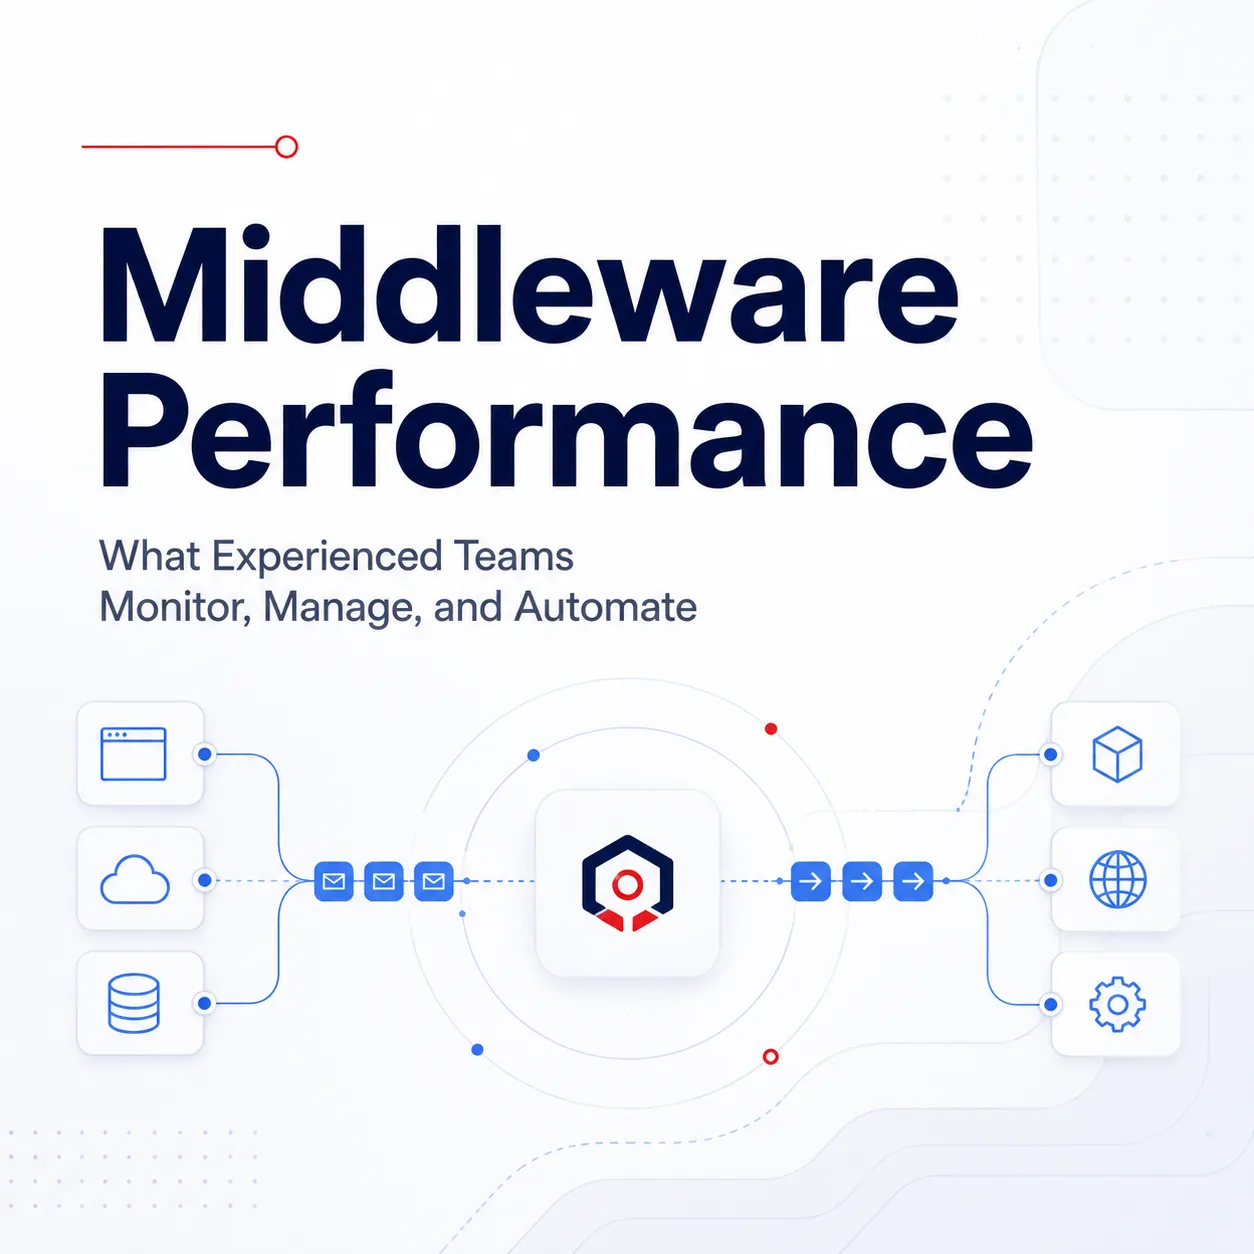
Middleware Performance: What Experienced Teams Monitor, Manage, and Automate
Middleware performance testing is the practice of validating how messaging and integration infrastructure behaves under realistic transaction patterns—not just whether a queue manager, broker, channel, or application endpoint is technically “up.” IBM’s documentation on monitoring your IBM MQ network emphasizes the value of gathering statistics and operational information to understand how the MQ network is running and to improve performance.[1]
For experienced middleware developers, engineers, architects, and administrators, the more useful question is often: Can this middleware path process the right messages, with the right headers and payloads, at the right pace, through the right route, before the business notices a problem?
That is where synthetic transactions become valuable.
In a middleware context, synthetic transactions are controlled, repeatable message-based tests that emulate real application activity. Instead of waiting for production traffic to expose a routing problem, backlog, malformed header, stalled consumer, or performance regression, teams can generate representative test messages and observe how the middleware environment behaves.
For IBM MQ and other enterprise messaging environments, middleware performance testing should not stop at simple “Hello World” messages. Useful tests need to reflect the way applications actually use middleware: message size, content type, persistence, headers, properties, routing rules, target queues, topics, and downstream dependencies.
For teams that want help designing practical MQ message tests, Avada offers a No Obligation IBM MQ Message Testing Consultation. It can be especially useful if you already know the queues, applications, or transaction paths that matter most, but need help turning them into reusable test cases.
Why Middleware Performance Testing Is Different from General Application Performance Testing
Middleware is often the connective tissue between systems that were built at different times, by different teams, and for different operational assumptions. In a typical enterprise environment, a single transaction may cross:
- IBM MQ queue managers, queues, channels, and topics
- ActiveMQ brokers, queues, and topics
- IBM ACE / IIB message flows
- Kafka brokers, topics, producers, and consumers
- Application servers such as WebSphere, JBoss, or Tomcat
- REST, SOAP, URL, database, or file-based dependencies
That means middleware performance testing needs to validate more than raw throughput. It should help answer operational questions such as:
- Are messages reaching the expected destination?
- Are routing rules behaving correctly after a change?
- Are queue depths, message age, EnQ/DeQ rates, and channel activity behaving as expected?
- Are messages with realistic headers and payloads being handled correctly?
- Are downstream applications, services, or databases responding within acceptable limits?
- Can the team repeat the same test after a deployment, infrastructure change, or incident?
- Can alerts or automated actions be triggered when a known condition appears?
General performance testing often focuses on application response time from the user or API perspective. Middleware performance testing focuses on the message path itself: what is placed on the queue or topic, where it goes, how quickly it moves, what it depends on, and how the environment responds when the workload changes.
Synthetic Transactions in Middleware Performance Testing
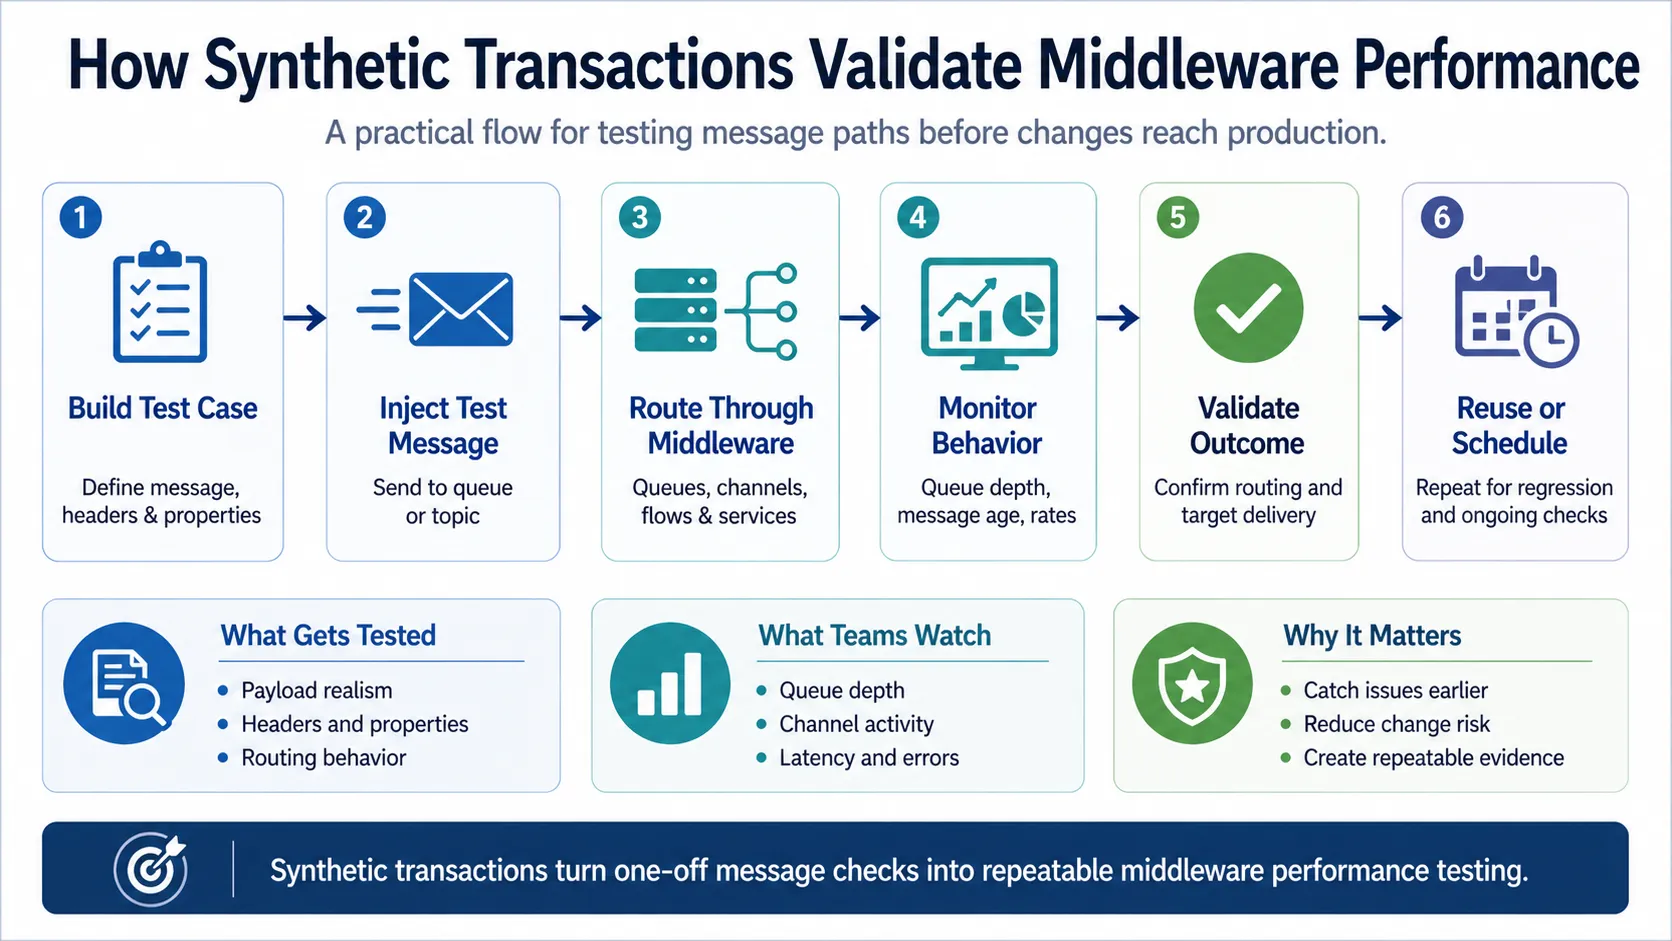
Synthetic transactions help teams build, send, route, monitor, validate, and reuse middleware performance tests.
Synthetic transactions give middleware teams a controlled way to test message movement without depending solely on live production traffic.
With Infrared360, teams can create reusable message test cases that generate simple or complex messages to queues or topics. These test cases can include MQI-style messages, JMS-style messages, message counts, header data sets, JMS properties, and data resources used as message content. Test messages can be built with realistic payloads and headers, then sent to defined target endpoints.
This matters because many middleware issues do not appear when the test message is too simple. A test that only confirms that one basic message can be placed on a queue may miss the real problem: a missing header, an unexpected RFH2 structure, a payload size issue, an incorrect property, a routing mismatch, or a downstream consumer that behaves differently when the message resembles production data.
Infrared360 synthetic transaction testing can support scenarios such as:
- Generating MQI and JMS-style test messages
- Applying one or more header data sets
- Using realistic message content from defined data resources
- Sending generated messages to one or more target queues or topics
- Clearing target queues before test execution when appropriate
- Scheduling tests to run once, repeatedly, or by CRON expression
- Reusing saved message test cases for regression, volume-oriented validation, historical review, auditing, or control comparisons
For a deeper IBM MQ-specific discussion, see Synthetic Transactions in MQ. For ActiveMQ environments, see Better ActiveMQ Performance Testing with Synthetic Transactions.
What to Monitor During Middleware Performance Testing
A good synthetic transaction test is only half the equation. The other half is knowing what to observe while the test runs.
In middleware performance testing, the most useful metrics depend on the platform and transaction path, but common areas include:
Queue and Queue Manager Behavior
For IBM MQ and ActiveMQ environments, teams should monitor queue managers, queues, channels, and messages. Useful indicators include queue depth, message age, EnQ/DeQ rates, open handles, readers, writers, and queue manager status.
These metrics help distinguish between different failure modes. For example, rising queue depth with normal enqueue activity may suggest consumer-side delay. High message age may indicate that messages are not being processed quickly enough. Channel status changes may point to transport, network, or configuration issues rather than application logic.
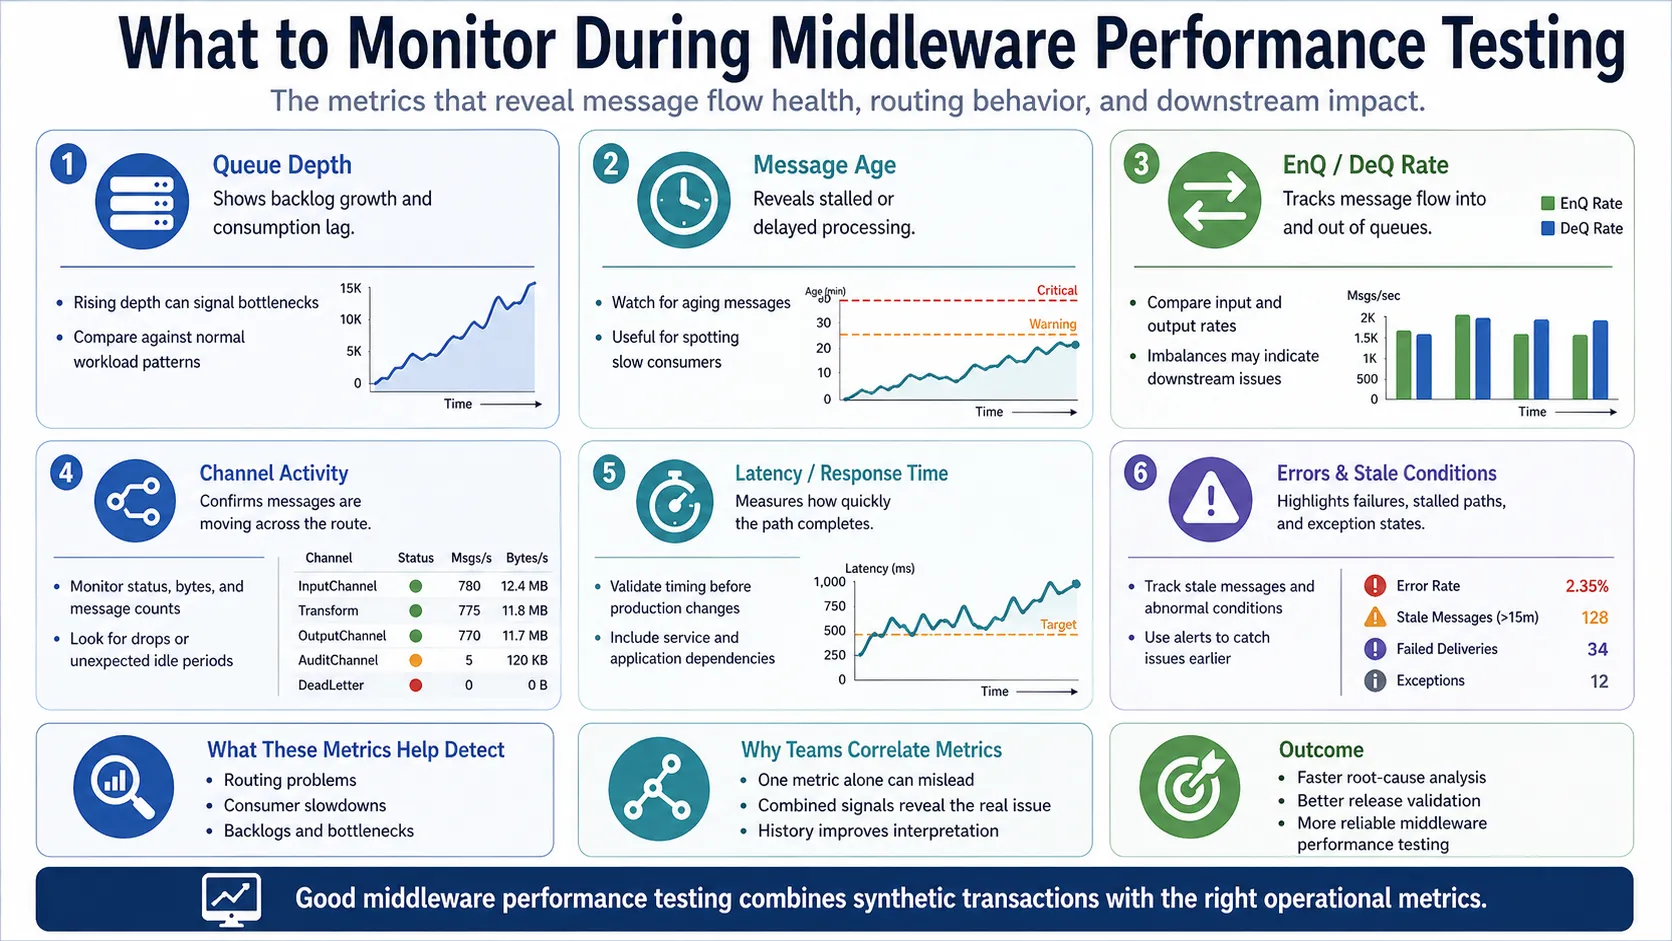
Middleware performance testing combines synthetic transactions with operational metrics that reveal message flow health.
Channel and Connection Activity
Middleware performance testing should also include channel and connection visibility. Channel activity, number of messages, bytes transferred, instances, and connection status can help identify whether messages are moving normally between queue managers or across environments.
This is especially important when the test scenario is designed to validate routing across multiple middleware components.
Message Flow and Application Integration Behavior
For IBM ACE / IIB environments, message flows, execution groups, applications, libraries, topics, publishers, subscribers, and statistics may be part of the performance picture. If a synthetic transaction enters a middleware path but does not produce the expected downstream result, visibility into the integration layer is essential.
Application Server and Service Dependencies
Middleware rarely fails in isolation. The queue may be fine, but a dependent application, web service, thread pool, database, or application server process may be saturated or unavailable.
Where relevant, Infrared360 can monitor application server status, enterprise application status, thread pools, connections, memory, web service latency, response time, availability, status codes, failure rates, and database table content or row counts. That allows teams to correlate message movement with the systems that consume, transform, or persist the data.
Latency, Traffic, Errors, and Saturation
Google’s Site Reliability Engineering guidance identifies latency, traffic, errors, and saturation as the “four golden signals” of monitoring.[2] In middleware performance testing, those signals translate well into practical questions:
- Latency: How long does the middleware path take to process or move the transaction?
- Traffic: How many messages, requests, or service calls are moving through the environment?
- Errors: Are messages failing, expiring, landing in exception paths, or producing incorrect downstream results?
- Saturation: Are queues, channels, logs, CPU, memory, thread pools, or dependent services approaching constrained states?
The value comes from correlating those signals across the middleware path, not viewing each metric in isolation.
Example: Testing a Message Route Before a Production Change
Consider a team preparing to modify a message routing rule for an application that uses IBM MQ and downstream integration services.
A weak test might put a small plain-text message on a queue, confirm that it was accepted, and call the change validated.
A stronger middleware performance testing approach would be to:
- Build a reusable message test case with realistic content, headers, and properties.
- Send the test message to the same queue or topic pattern used by the application.
- Validate that the message routes to the expected destination.
- Monitor queue depth, message age, EnQ/DeQ activity, channel status, and downstream service behavior.
- Confirm that no unexpected backlog or stale message condition appears.
- Save the test case so it can be reused after future configuration changes, releases, or infrastructure updates.
That is a more useful test because it validates behavior, not just connectivity.
Why Reusable Test Cases Matter
Middleware teams often perform the same checks repeatedly: after deployments, queue manager changes, routing updates, certificate changes, integration changes, failover events, or incident remediation.
Without reusable test cases, those checks tend to become manual and inconsistent. One engineer may use a different payload than another. One administrator may test one queue while another tests a related route. Over time, the test becomes less reliable as evidence.
Reusable synthetic transaction test cases help standardize that process.
They also create a shared operational reference. A middleware engineer, application support specialist, QA team member, or administrator can run a known test and compare current behavior against previous results. That is especially useful when different teams own different parts of the transaction path.
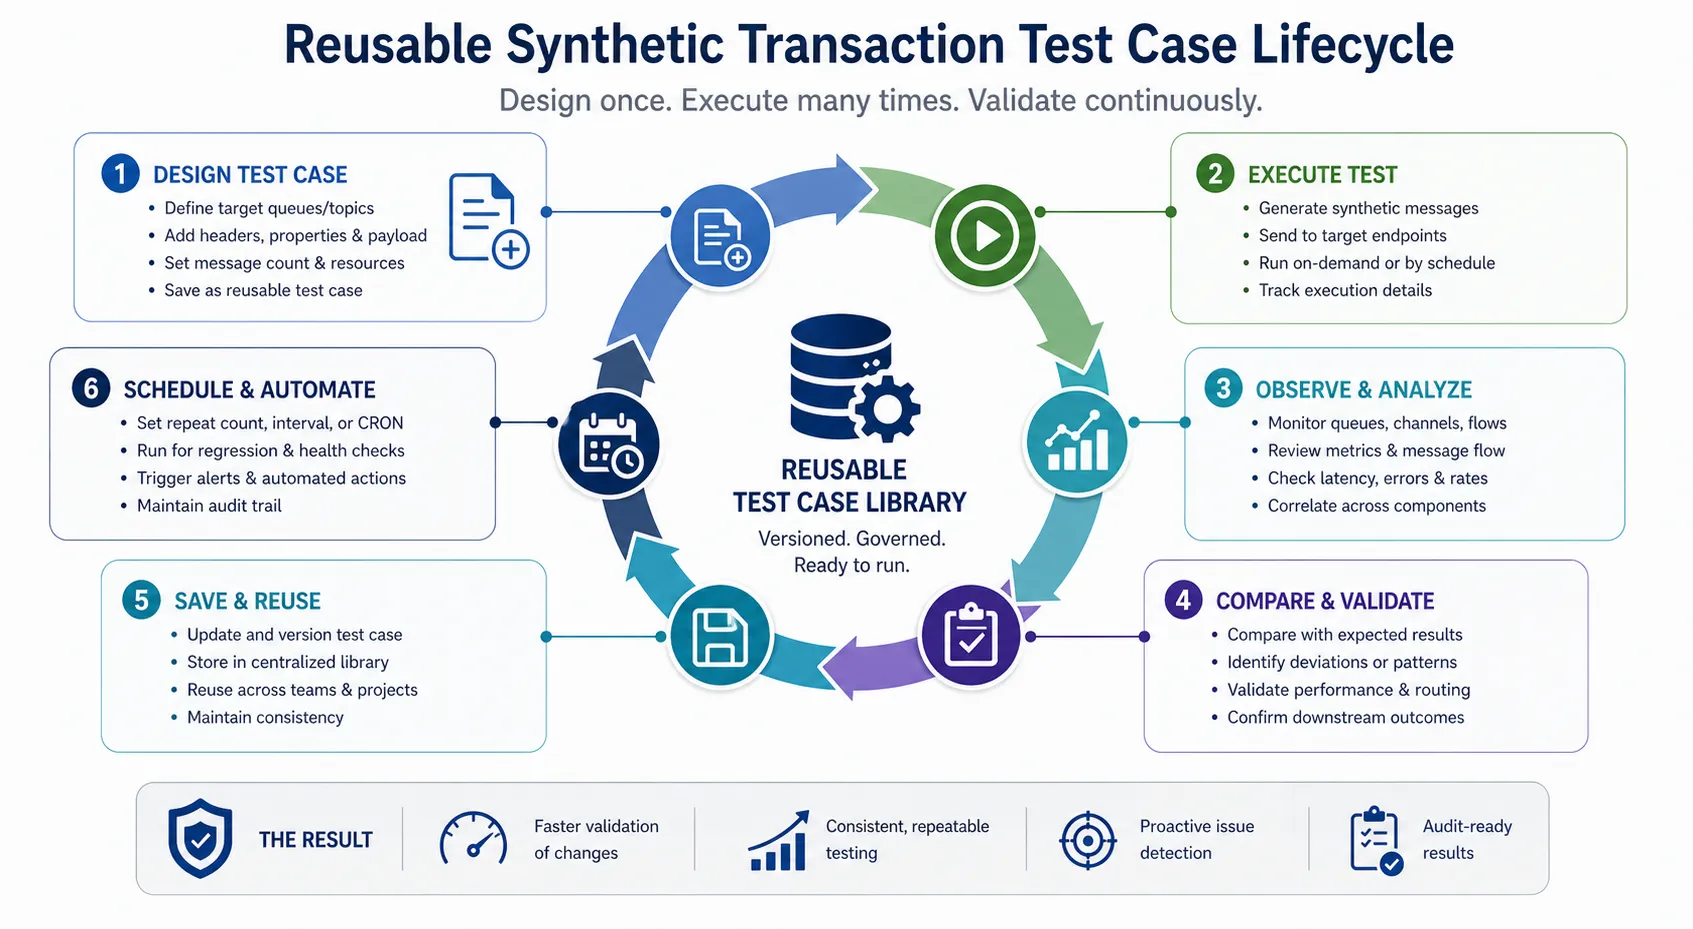
Reusable synthetic transaction test cases help teams design once, execute repeatedly, and validate continuously.
Scheduling Middleware Performance Tests
Scheduled synthetic transactions are useful when teams want to validate known paths regularly, not just during project work.
Infrared360 message test cases can be scheduled with repeat counts, repeat intervals, start dates, end dates, or CRON expressions. That allows teams to run message tests at defined times or recurring intervals.
Scheduling can be useful for:
- Validating important message routes before business hours
- Running repeatable tests after planned maintenance
- Checking known integration paths during release windows
- Creating control specimens for comparison
- Supporting regression testing after middleware or application changes
- Confirming that expected routing and target applications remain available
The point is not to generate noise. The point is to run controlled, purposeful tests that reflect important middleware paths.
Middleware Performance Testing and Unified Management
Synthetic transaction testing becomes more useful when it is connected to monitoring, administration, alerting, analytics, automation, and auditing in the same operational interface.
If testing is isolated from monitoring, teams may generate messages but still need to jump between tools to understand what happened. If monitoring is isolated from administration, teams may see a problem but still need another tool or another team to act. If actions are not audited, regulated environments may struggle to prove who did what and when.
Infrared360 brings middleware testing into the same portal used for real-time monitoring, administration, alerting, analytics dashboards, automation, delegated access, and audit trails.
That matters for experienced middleware teams because the performance testing workflow is rarely just “send a message.” It is more often:
- Generate the test transaction.
- Observe the middleware path.
- Review current and historical metrics.
- Identify the affected queue, channel, flow, service, or dependency.
- Take corrective action if needed.
- Confirm the result.
- Preserve an audit trail.
A unified solution shortens that loop.
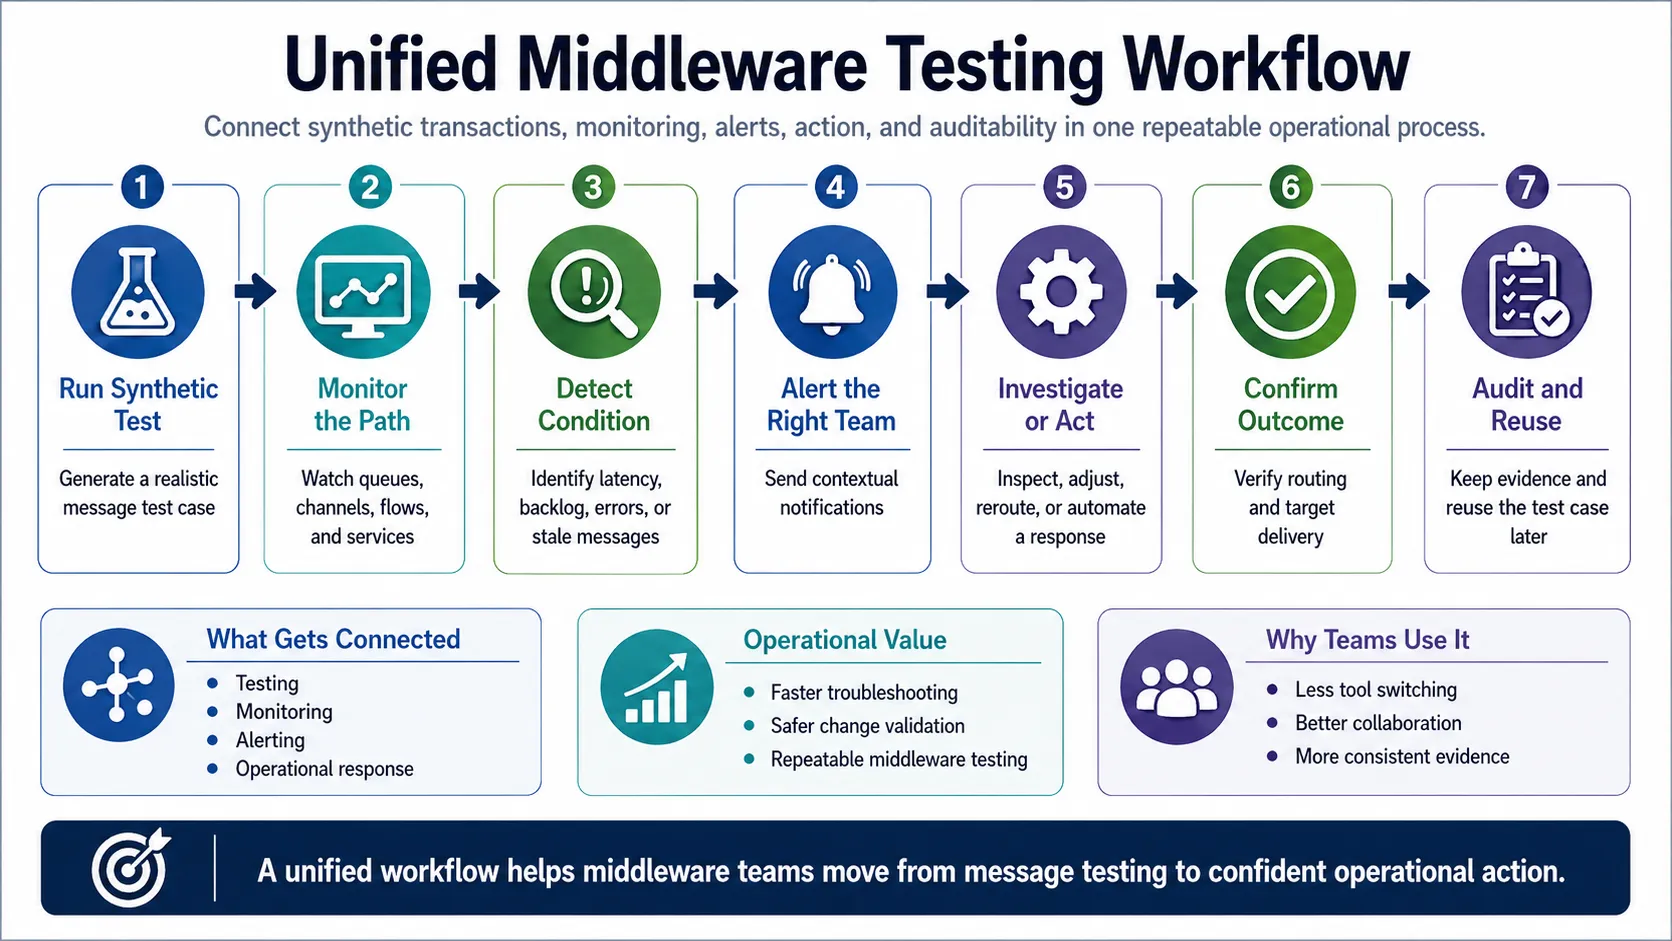
A unified testing workflow connects synthetic transactions, monitoring, alerting, operational response, and auditability.
Automation in Middleware Performance Testing
Automation can improve middleware performance testing when it is applied carefully.
For example, alerts can be tied to conditions such as queue depth, message age, channel status, EnQ/DeQ rates, or other middleware events. In some cases, automated responses can trigger services or corrective actions when known conditions occur.
That can help teams move from passive detection to controlled response. For example, if a synthetic transaction reveals a known failure pattern, the system can notify the right team, trigger a service, or support a predefined remediation workflow.
For middleware administrators and architects, the key is governance. Automation should be tied to clear rules, proper permissions, appropriate audit trails, and an understanding of which actions are safe to run automatically versus which require human review.
Middleware Performance Testing for Modernization Projects
Middleware modernization adds another reason to use synthetic transactions.
When teams move workloads across environments, introduce containers, change routing patterns, update integration flows, or connect legacy systems to newer applications, they need a way to prove that message behavior remains consistent.
Synthetic transactions can help validate:
- New or modified message routes
- Queue or topic behavior after configuration changes
- Application cutover readiness
- Middleware behavior across hybrid environments
- Regression after infrastructure updates
- Downstream service or database availability
- Changes in message volume or message shape
Modernization does not eliminate middleware complexity. It often redistributes it. Middleware performance testing gives teams a repeatable way to verify that the new environment still supports the transaction paths the business depends on.
Practical Middleware Performance Testing Checklist
Use this checklist when building a middleware performance testing plan with synthetic transactions:
Define the Transaction Path
Identify the queue, topic, route, channel, message flow, application, service, and database dependencies involved in the test.
Use Realistic Message Structures
Include the headers, properties, formats, payload sizes, and content types that represent actual application behavior.
Establish Expected Outcomes
Define what should happen when the test runs. The expected result may include destination, timing, queue behavior, response code, database update, or downstream application behavior.
Monitor the Right Metrics
Track queue depth, message age, EnQ/DeQ activity, channel status, connection behavior, message flow statistics, application server status, web service response, and database indicators where relevant.
Save and Reuse Test Cases
Turn one-off tests into reusable controls. That makes future release validation and incident follow-up more consistent.
Schedule Tests Where Appropriate
Run important tests on a schedule when there is a clear operational reason to do so.
Connect Testing to Alerting and Automation
Use alerts, notifications, and controlled automation to reduce response time when known issues appear.
Keep Access Delegated and Audited
Ensure users can test and manage only the middleware objects they are authorized to access, while preserving an audit trail of actions.
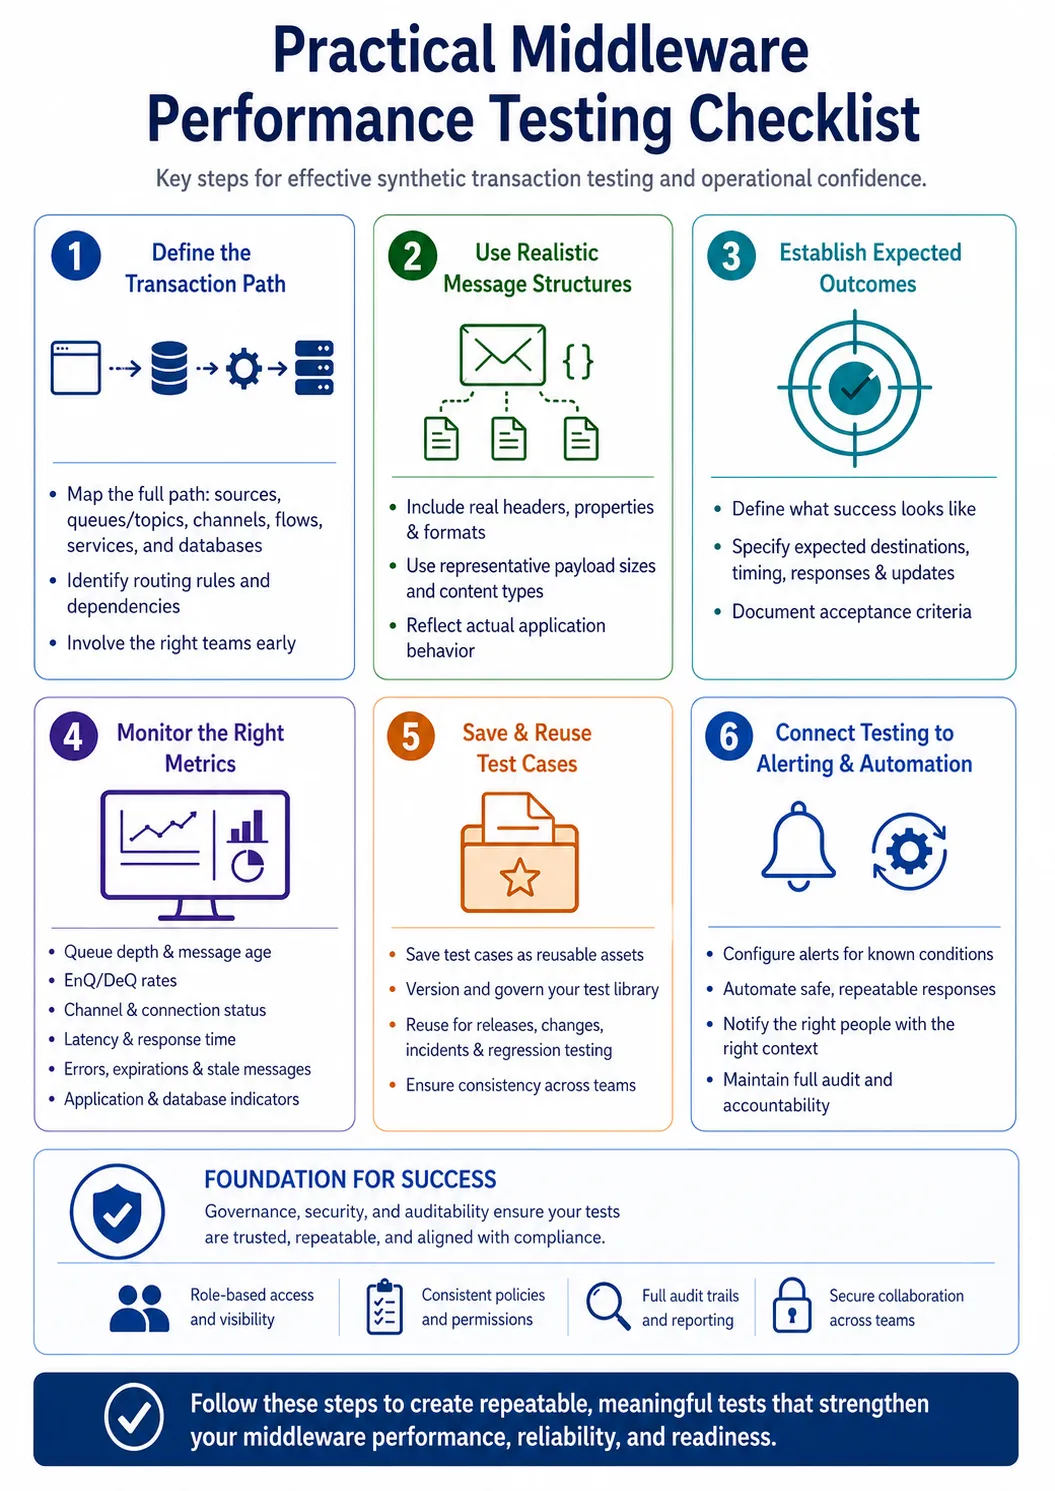
A practical checklist for creating repeatable synthetic transaction tests and improving middleware performance confidence.
Common Middleware Performance Testing Mistakes
Experienced teams usually do not need more testing for the sake of testing. They need better tests. Avoid these common problems:
Testing with Oversimplified Messages
A small plain-text message may confirm basic connectivity, but it may not reveal header, property, payload, or routing issues.
Testing Only One Component
Middleware performance problems often appear between systems. Testing only the queue manager, broker, or application endpoint may miss the actual source of the problem.
Ignoring Historical Behavior
A metric is more useful when compared to a known baseline or previous test. Historical reporting and analytics help teams identify whether current behavior is normal, degraded, or unusual.
Separating Testing from Management
If the test shows a problem but the team must switch tools to investigate, administer, notify, or remediate, the process slows down.
Not Preserving Evidence
For regulated or complex environments, auditability matters. Teams should be able to review what test ran, when it ran, and what actions were taken afterward.
How Infrared360 Supports Middleware Performance Testing
Infrared360 supports middleware performance testing by combining synthetic transaction generation with monitoring, management, alerting, analytics, automation, delegated access, and auditing.
For message-based environments, Infrared360 can generate and save message test cases, apply headers and properties, use defined data resources, send messages to target destinations, and schedule test execution. These capabilities help teams create repeatable synthetic transaction tests that better reflect real-world middleware behavior.
For monitoring and management, Infrared360 gives teams visibility into middleware resources such as queue managers, queues, channels, topics, brokers, message flows, application servers, web services, and databases. It also supports alerting, reporting, analytics dashboards, administrative actions, and automation from a single interface.
For enterprise operations, delegated visibility and control are equally important. Developers, QA teams, application support, middleware administrators, and architects often need access to different parts of the middleware environment. Infrared360 Trusted Spaces™ helps organize that access so users can see and act on the resources relevant to their responsibilities without unnecessary exposure to the rest of the environment.
The result is a more practical approach to middleware performance testing: generate realistic test traffic, monitor the behavior, act when needed, and retain the operational evidence.
FAQ
Endnotes
- IBM Documentation, “Monitoring your IBM MQ network,” explains that IBM MQ provides monitoring techniques to obtain statistics and other information about how a queue manager network is running, and that this information can help improve performance.
- Google Site Reliability Engineering, “Monitoring Distributed Systems,” identifies latency, traffic, errors, and saturation as the four golden signals of monitoring.
- IBM Support, “Interpreting the IBM MQ Performance Check Report,” describes mqperfck as a tool that provides insight into queue manager workload and reports statistics for transaction logs, queues, and channels; IBM also notes it is a snapshot tool rather than a continuous monitoring solution.
- IBM Documentation, “Displaying queue and channel monitoring data,” describes real-time monitoring information for queues and channels and notes that collecting and checking these values regularly can reveal fluctuations that indicate performance changes.
- Microsoft Engineering Fundamentals Playbook, “Performance Testing,” defines performance testing as testing intended to determine responsiveness, throughput, reliability, and/or scalability under a given workload.
Related Posts




More Infrared360® Resources
About the Author: Scott Treggiari