On this page
This is Part 5 of a 5-part series exploring The Protobuf Visibility Gap in Kafka Operations | Previous Article
A custom Kafka consumer is often the first troubleshooting idea when a team needs to inspect Protobuf data. The logic appears simple: obtain the schema, connect to the topic, deserialize the record, and print the fields. In practice, even a temporary diagnostic program can become a small project.
The developer needs the correct client libraries, serializer or deserializer, schema files or Registry access, security credentials, network connectivity, topic permissions, and a safe place to run the code. Production access may require review. Sensitive fields should not be written to an uncontrolled terminal or log. The program must locate the right partition and offset without unintentionally consuming or altering application state.
For a recurring operational need, a governed administration tool can provide a faster and safer path. Infrared360 can use a customer-provided .proto definition directly to decode supported Protobuf records, allowing authorized users to inspect selected topic content without first creating a diagnostic application.
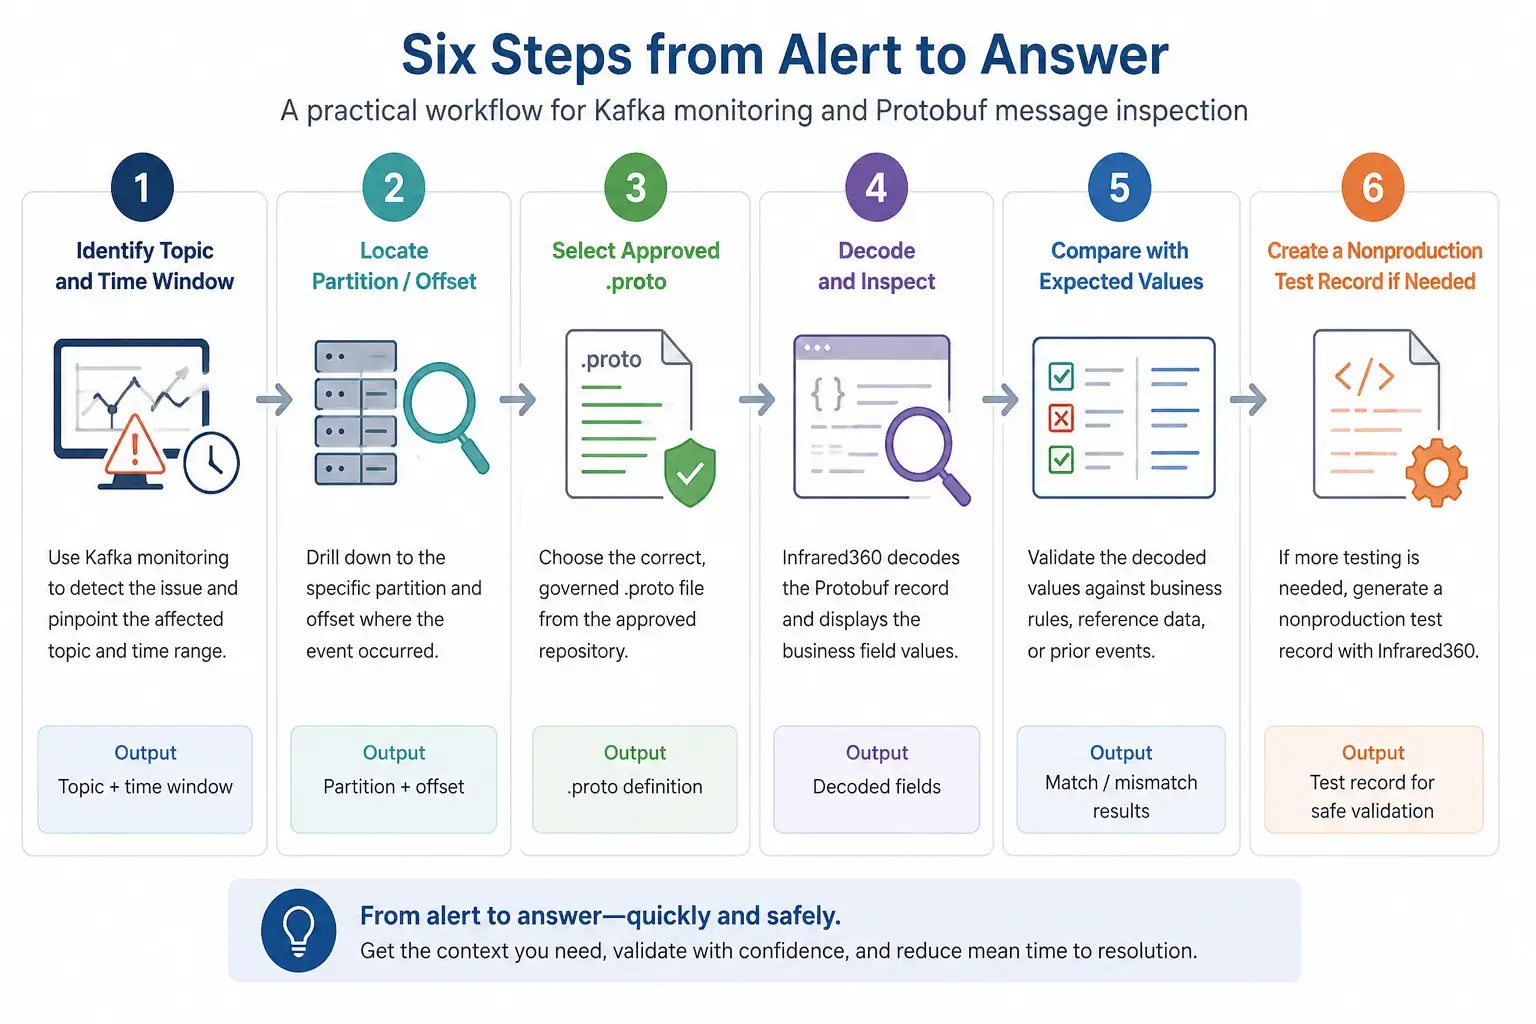
Workflow to troubleshoot Protobuf Kafka messages from alert through safe validation.
Step 1: Start with a precise incident question
Avoid beginning with “show me everything in this topic.” Define what the team is trying to prove. Examples include: Did the producer send the new enum value? Was the amount populated in the expected unit? Which schema version matches the failed record? Did the event contain the identifier required by the consumer?
A precise question limits the amount of sensitive content that must be viewed and helps the team choose the relevant record. Monitoring, traces, application logs, deployment records, and business exception reports may provide the topic, timestamp, key, partition, offset, producer, or consumer involved.
Step 2: Locate the record without disturbing processing
Kafka assigns offsets within each partition. Apache Kafka describes an offset as the permanent identifier for a position in the log, although compaction may remove the record that originally occupied an older position.[1] The investigation should therefore use the most specific location available and account for the topic’s retention and compaction policies.
An administration workflow should inspect records independently of the application consumer group. The goal is not to advance a production consumer’s committed offset or replay data unintentionally. Confirm how the tool reads topic content and what permissions it requires.
Step 3: Obtain the approved .proto definition
Protobuf records are not inherently self-describing. The .proto definition supplies the field numbers, names, types, nested messages, enums, and other information required to interpret the bytes.[2] Use the definition associated with the producer and record version, not simply the newest file in a repository.
Treat the definition as controlled application metadata. Confirm imports, dependencies, package names, and the intended top-level message type. When multiple teams publish to the same topic, determine whether the topic contains more than one record type.
Step 4: Decode and inspect the business fields
Apply the definition to the selected record and review the fields related to the incident question. Start with identifiers and metadata: event type, version, producer, timestamp, and correlation or transaction ID. Then inspect the business values relevant to the failure.
Look for four categories of issues. Structural issues include a message type or field definition mismatch. Presence issues include missing or defaulted fields. Value issues include an amount, date, status, or code that is allowed by the schema but wrong for the business rule. Version issues occur when the producer and consumer interpret the record using incompatible definitions.
Diagnostic findings and likely next owners
| Finding | What It Suggests | Likely Next Action |
|---|---|---|
| Record cannot be decoded with the expected .proto | Wrong definition, unsupported framing, corrupted data, or unexpected message type. | Confirm producer serialization and schema/version ownership. |
| Record decodes but a required business field is absent | Producer logic, mapping, or version mismatch. | Return the offset and decoded evidence to the producer team. |
| Record is correct but the consumer rejects it | Consumer deserializer, schema version, or business-rule defect. | Test the consumer with the same record or a controlled equivalent. |
| Only records after a deployment fail | Change-related incompatibility or mapping regression. | Compare pre- and post-deployment records and definitions. |
| The selected record is no longer retained | Retention or compaction removed the evidence. | Use adjacent records, logs, archives, or reproduce in nonproduction; review future evidence-retention procedures. |
Step 5: Correlate content with telemetry and application evidence
A decoded record is one piece of evidence. Correlate it with produce and consume times, application errors, processing duration, consumer behavior, and deployments. OpenTelemetry defines messaging telemetry for operations such as sent messages, consumed messages, and processing duration.[3] Those signals help establish where the record traveled and when the failure occurred.
This correlation prevents premature conclusions. A surprising value may be legitimate for a new business case. A parsing failure may come from an outdated consumer rather than a bad producer. A record may be correct at the source topic and incorrect only after a transformation.
Step 6: Reproduce safely with a controlled test record
When the investigation requires reproduction, construct a test record using the approved definition and send it to a designated nonproduction topic. Change only the field relevant to the hypothesis. Record the test case, expected result, actual result, and schema version.
Confluent’s message browser can generate, validate, and produce messages using associated schemas.4 Infrared360 can also support creation and production of Protobuf test records through its administrative workflow. The key governance question is not merely whether a tool can produce a message, but who is authorized to do so and in which environment.
Why an administrative workflow can be better than temporary code
A reusable tool reduces repeated engineering effort. The support team does not need a different diagnostic consumer for every topic or incident. Access can be governed through roles rather than copied into local configuration files. Actions can be audited. The same workflow can be documented and trained across shifts and teams.
It also creates a clearer boundary between operations and development. Operations inspects and gathers evidence. Developers maintain the producer, consumer, and schema. The organization avoids turning every message-content question into an emergency software-delivery task.
When custom code is still appropriate
An administration tool is not a universal replacement for applications. Custom code may be appropriate when the team needs large-scale processing, complex transformations, automated field-level analytics, continuous content validation, or specialized support for an uncommon serializer. It may also be required when the record framing or schema features are outside the tool’s supported capabilities.
The decision should be proportional. Use direct inspection for focused operational questions. Use purpose-built consumers and stream-processing applications for sustained workloads and automated business logic.
A production-ready operating procedure
Document the approved sources for .proto files, the roles allowed to inspect payloads, and the topics and environments each role can access. Define how users locate records, how sensitive fields are handled, and when screenshots or exports are permitted. Separate read-only inspection from producing test records.
Include retention awareness. If critical incident evidence may disappear quickly, monitoring and support procedures should capture the topic, partition, offset, key, timestamp, and schema version as soon as an exception occurs. The organization may also need an approved archive or replay strategy for high-value events.
Finally, test the procedure before an incident. Select representative Protobuf records, verify decoding, confirm permissions, and run a nonproduction reproduction exercise. The first time a team learns how to inspect a binary record should not be during a production outage.
The takeaway
Troubleshooting Protobuf Kafka records should not automatically require writing and deploying a consumer. A direct .proto-based administration workflow can move the team from an alert to readable evidence with fewer handoffs and less temporary code.
The strongest process combines precise record location, controlled schema use, role-based access, message inspection, telemetry correlation, and safe nonproduction testing. That is how Protobuf visibility becomes an operational capability rather than a one-off development exercise.
FAQ
Endnotes
- Apache Kafka Documentation, “Design: Log Compaction.” https://kafka.apache.org/42/design/design/
- Protocol Buffers Documentation, “Overview.” https://protobuf.dev/overview/
- OpenTelemetry, “Semantic Conventions for Messaging Client Metrics.” https://opentelemetry.io/docs/specs/semconv/messaging/messaging-metrics/
- Confluent Documentation, “Use Message Browser in Confluent Cloud.” https://docs.confluent.io/cloud/current/topics/messages.html