Kafka Monitoring Can Show the Symptom. Protobuf Record Inspection Can Reveal the Cause
This is Part 2 of a 5-part series exploring The Protobuf Visibility Gap in Kafka Operations | Previous Article | Next Article
Kafka operations teams depend on monitoring because distributed streaming systems can fail in many ways. Brokers can become unavailable, partitions can lose preferred leaders, consumers can lag, producers can encounter errors, and processing time can increase. Metrics and traces help teams detect these conditions and understand where a flow slowed or failed.
But an event-streaming platform can be technically healthy while carrying incorrect business data. A producer may populate the wrong account status, use an unexpected currency, omit a routing value, assign an invalid identifier, or send a field that a consumer does not recognize. The record can be accepted, replicated, and delivered exactly as Kafka was designed to do. The infrastructure did its job; the data was still wrong.
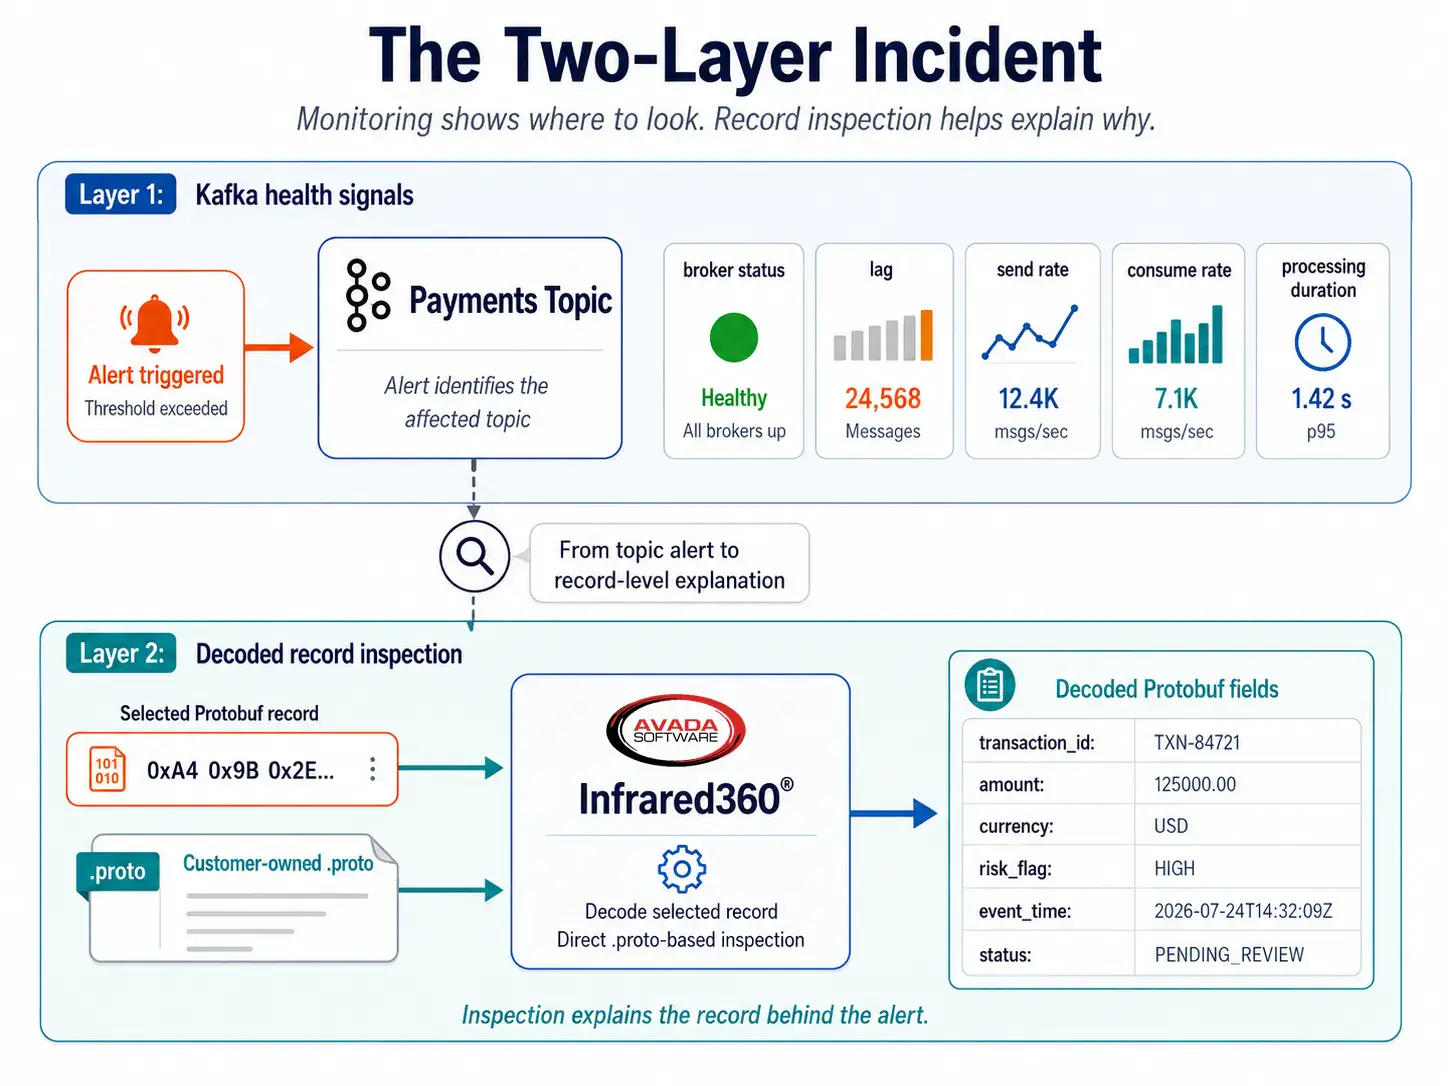
Kafka monitoring and Protobuf message inspection work together.
What Kafka monitoring is designed to answer
OpenTelemetry’s messaging conventions illustrate the monitoring layer. The standard defines common telemetry for messaging operations, including operation duration, messages sent, messages consumed, and processing duration.[1] Its Kafka-specific semantic conventions add Kafka attributes to spans and related telemetry.[2] These signals help teams understand system behavior: whether producers are sending, consumers are receiving, operations are slow, or errors are occurring.
Those signals are valuable precisely because they are standardized and aggregateable. A dashboard can show a spike in consumer delay without exposing every record. An alert can identify a failed operation without copying sensitive payload content into a telemetry platform. Monitoring is optimized for detecting patterns and abnormal conditions across many events.
That design also creates a boundary. Standard operational telemetry generally describes the messaging operation rather than decoding every business field in every payload. A metric can report that 10,000 messages were consumed; it does not determine that one record carried an invalid settlement date. A trace can show where processing failed; it may not reveal which Protobuf field violated an application rule.
The direct .proto workflow
Infrared360® provides a different operational path. Instead of connecting to Confluent Schema Registry to retrieve the definition, Infrared360 can use a customer-provided .proto file directly to decode a supported Protobuf record. The user selects the applicable definition and inspects the record in a readable structure.
This does not make Schema Registry unnecessary. Schema Registry serves important development and governance functions, including schema storage, compatibility checking, reuse, and controlled evolution. Direct .proto-based inspection solves a different problem: giving an authorized operator a way to understand record content when the native browser’s schema-association requirements do not match the situation.
What each layer can answer
| Question | Monitoring / Telemetry | Protobuf Record Inspection |
|---|---|---|
| Are brokers and partitions available? | Primary source of evidence. | Not the purpose of record inspection. |
| Are producers sending and consumers receiving? | Shows rates, errors, duration, and lag-related conditions. | Confirms the content of a selected produced or retained record. |
| Which record caused a parse or validation error? | May identify the failing operation, service, topic, timestamp, or offset. | Can decode the selected record so fields can be examined. |
| Is the business value correct? | Cannot determine correctness from infrastructure metrics alone. | Allows an authorized user to compare decoded values with expected rules. |
| Can the team reproduce the issue? | Shows when and where the issue occurred. | A test record can be constructed and produced for controlled validation. |
The moment monitoring stops being enough
Imagine that consumer errors rise immediately after a producer release. Monitoring narrows the problem to one application, topic, and time window. The application log says that a record could not be parsed, but the log does not retain the payload because the data is sensitive. The producer team believes it followed the correct schema. The consumer team believes the record contained an unsupported value.
At that point, more aggregate metrics may confirm the incident but not resolve the disagreement. The team needs a controlled way to inspect a representative record. For Protobuf data, that requires the correct definition. Infrared360 can use the customer-provided .proto file directly to decode a supported record and present the fields to an authorized operator.
This is the practical connection between monitoring and administration. Monitoring directs attention. Record inspection provides evidence. The operator may discover that the payload is valid and the consumer is using an outdated definition. Or the operator may find that the producer omitted a field, used a deprecated enum value, or populated the right field with the wrong business value.
Why payload visibility should be controlled
The answer is not to place full message payloads into every monitoring system. Payloads may contain personal, financial, healthcare, or proprietary information. Broadly copying them into logs and telemetry can expand the sensitive-data footprint and make access harder to govern.
A safer model separates detection from inspection. Monitoring remains broad and continuous. Message-content access is narrow, intentional, role-based, and auditable. Infrared360 is designed around persona-based access, delegated administration, and audit trails across middleware operations.[3] That allows an organization to decide which users may inspect which topics and records rather than giving all dashboard users access to business content.
A practical alert-to-evidence workflow
The workflow begins with an alert or anomaly. The operations team identifies the affected cluster, broker, topic, partition, consumer group, service, and time window. It correlates telemetry with application logs and deployment events. If the available evidence points toward message content, an authorized user retrieves or selects the relevant record and applies the approved .proto definition.
The team then examines the decoded fields against the expected contract and business rules. Was the schema version expected? Are required identifiers present? Does the event timestamp make sense? Is a status value allowed? Does the amount use the expected unit? If the record appears correct, attention shifts to the consumer or transformation logic. If the record is wrong, the evidence can be returned to the producer team.
Finally, the team can create a controlled test record and produce it to an approved nonproduction topic. That helps separate schema and parsing problems from business-rule problems. It also gives developers a repeatable case without requiring operations to build a permanent consumer application.
Kafka retention makes timely inspection important
Kafka records are retained according to topic policies. Under delete-based retention, old log segments are discarded after configured time or size limits. Under compaction, Kafka retains the latest value for each key while older records may be removed.4 A troubleshooting process therefore needs to identify and inspect relevant records before retention or compaction eliminates the exact evidence the team needs.
Monitoring contributes the timestamp, offset, partition, and surrounding conditions. Record inspection contributes the decoded values. Together they create a more complete incident record than either approach can provide alone.
Avoiding two common positioning mistakes
The first mistake is to claim that message inspection replaces observability. It does not. Teams still need telemetry across brokers, producers, consumers, applications, and infrastructure. The second mistake is to assume that observability automatically provides payload understanding. Metrics and traces can be comprehensive while leaving the business fields inside a binary record unreadable to operations.
The more useful position is layered: monitor continuously, investigate selectively, and control access carefully. Infrared360 combines middleware monitoring and administration in one portal, allowing teams to move from an operational signal to an authorized action without treating every payload as telemetry.[3]
The takeaway
A Kafka alert answers “Where should we look?” Protobuf-aware record inspection can answer “What did this event actually say?” When a technically healthy pipeline carries invalid business values, that second question often determines whether an incident lasts minutes or hours.
Organizations should evaluate monitoring and message inspection as complementary capabilities. The goal is not maximum payload exposure. It is fast, governed access to the minimum evidence required to diagnose the problem and restore reliable processing.
FAQ
Endnotes
- OpenTelemetry, “Semantic Conventions for Messaging Client Metrics.” https://opentelemetry.io/docs/specs/semconv/messaging/messaging-metrics/
- OpenTelemetry, “Semantic Conventions for Kafka.” https://opentelemetry.io/docs/specs/semconv/messaging/kafka/
- Avada Software, “Infrared360 Product Details.” https://avadasoftware.com/infrared360-product-details/
- Apache Kafka Documentation, “Design: Log Compaction.” https://kafka.apache.org/42/design/design/
Related Posts






More Infrared360® Resources
About the Author: Scott Treggiari