

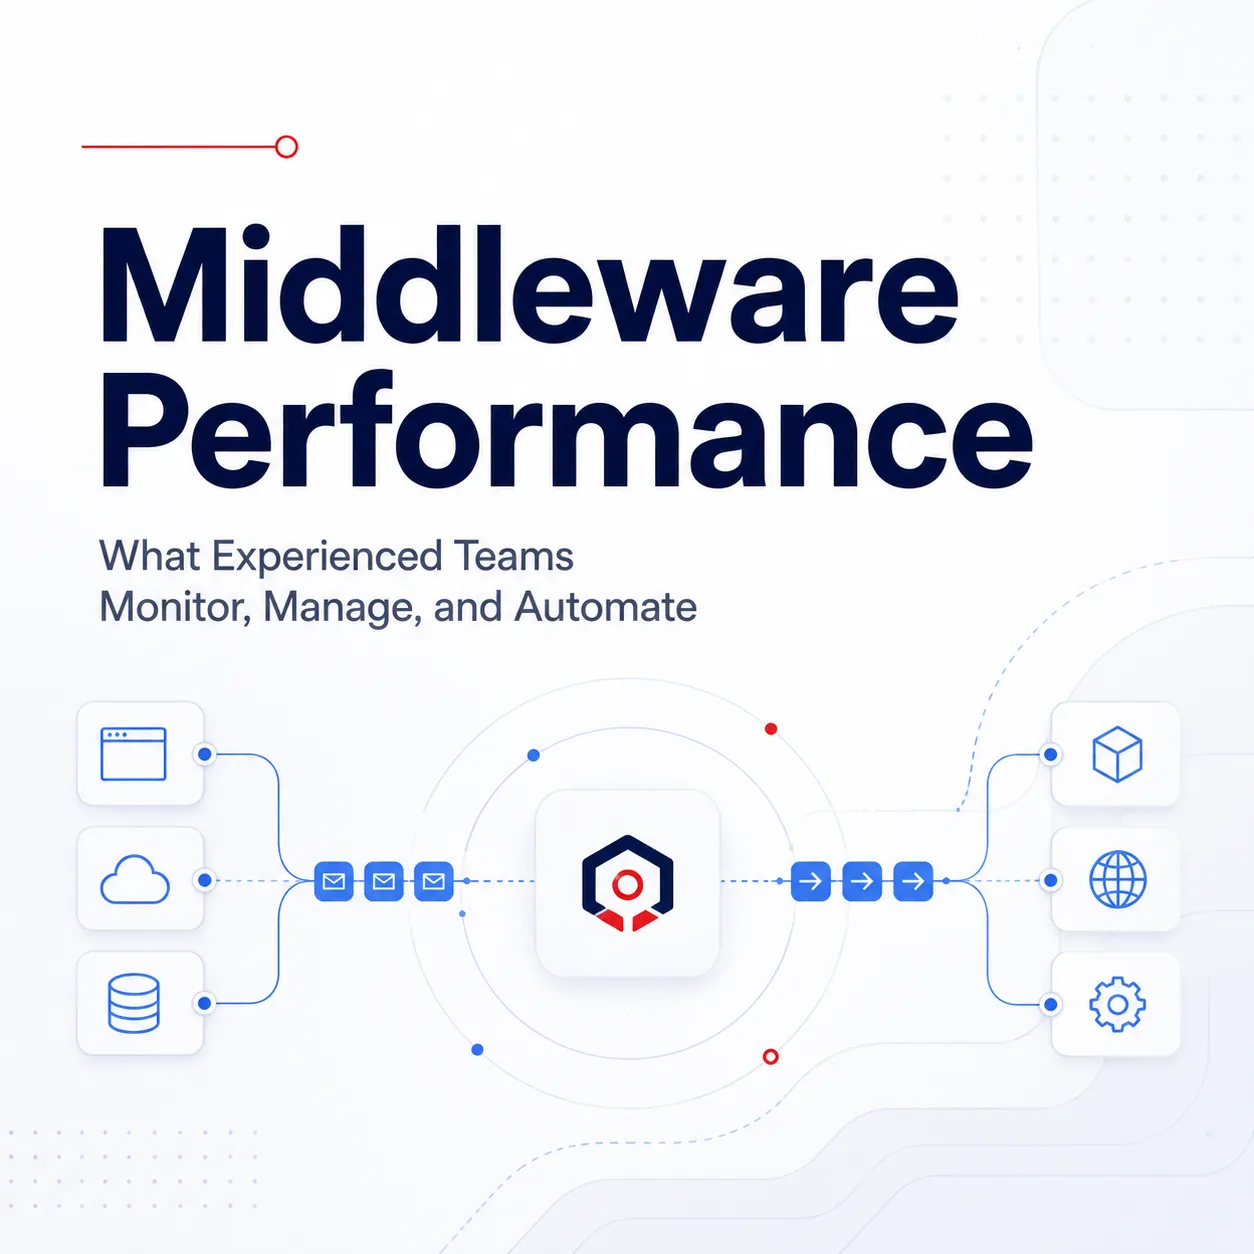
Middleware Performance: What Experienced Teams Monitor, Manage, and Automate
Middleware performance is not just about whether servers are up or whether an application appears available. For teams responsible for IBM MQ, ActiveMQ, Kafka, IBM App Connect Enterprise, application servers, and related integration infrastructure, middleware performance is about whether messages, events, transactions, and dependent services are flowing as expected.
A queue can be “up” while messages are aging. A broker can be available while consumer behavior is deteriorating. A flow can be deployed while a downstream dependency is introducing latency. A channel can recover intermittently while still creating operational risk. These are the kinds of conditions experienced middleware engineers, architects, and administrators care about because they understand that performance degradation often appears before an outage.
That is why middleware performance requires more than infrastructure monitoring. It requires middleware-specific visibility, real-time alerting, administrative control, historical context, and automation that can support faster, safer operational response.
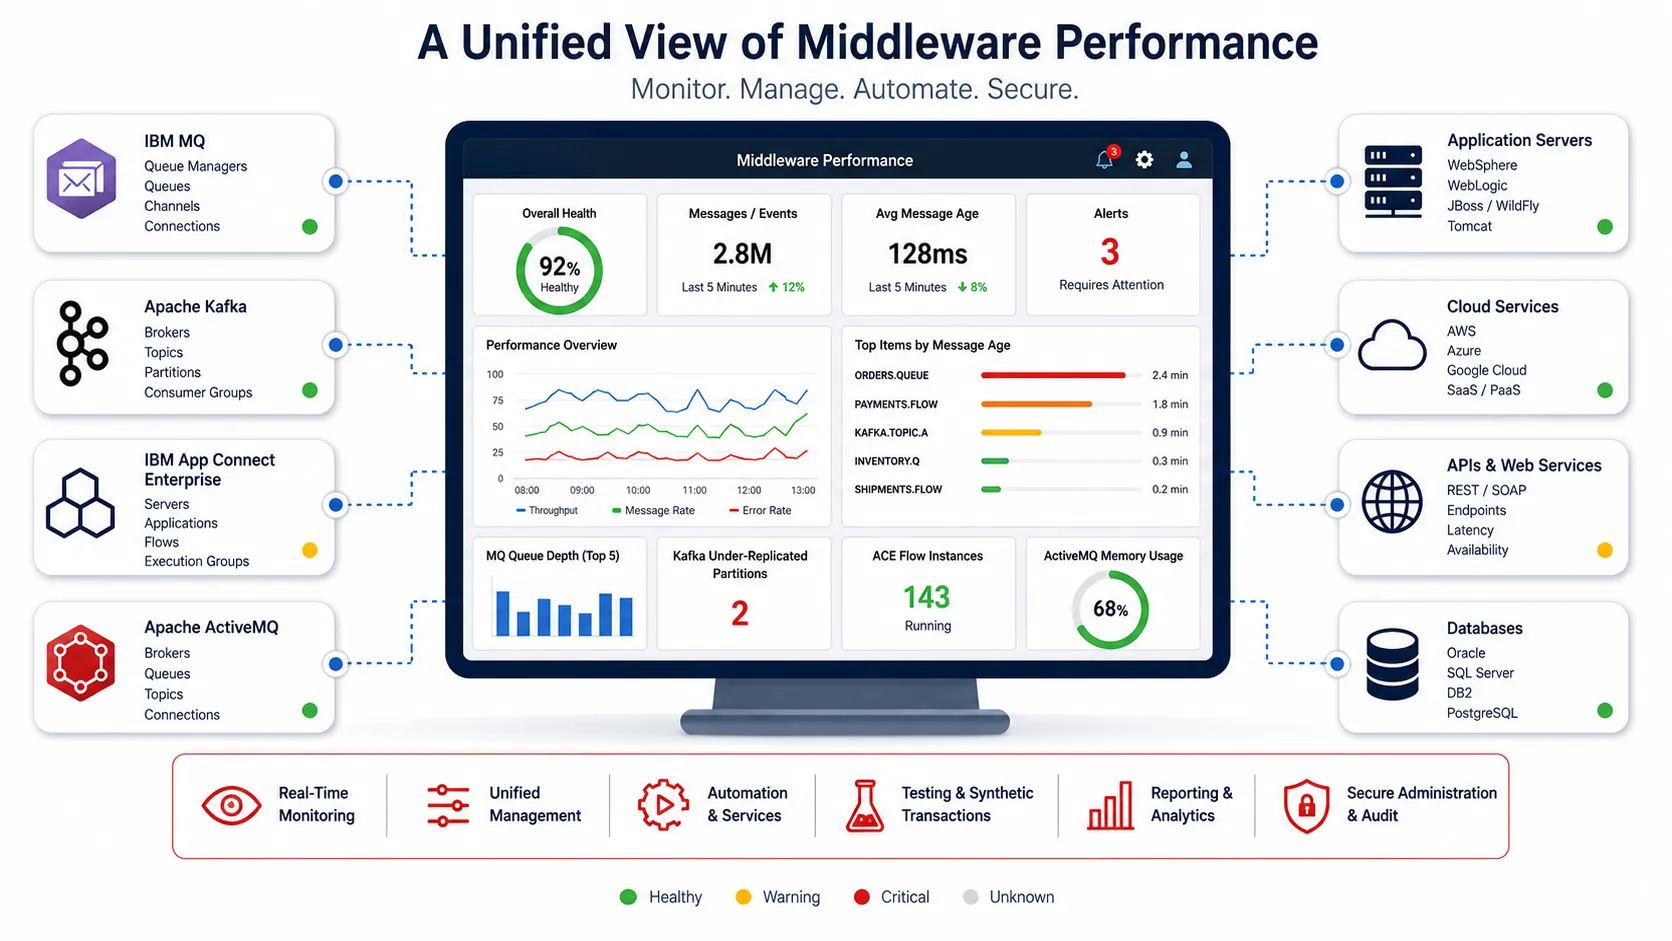
A unified view of middleware performance across distributed queues, brokers, message flows, event streams, and integration systems.
What Middleware Performance Really Means
Middleware performance is the ability of the middleware layer to move, process, route, and manage work reliably under real operating conditions. In practical terms, that means monitoring throughput, backlog, latency indicators, object status, connection health, message movement, resource usage, and dependency behavior across the technologies that support enterprise applications.
For IBM MQ teams, that may include queue depth, message age, enqueue and dequeue rates, last put and get activity, uncommitted messages, channel status, channel instances, queue manager status, connection count, certificate expiration, readers, writers, and open handles.
For Kafka teams, middleware performance may involve broker status, active controller count, under-replicated partitions, offline partitions, ISR shrink or expansion rates, leader election rates, producer and consumer request response times, bytes in and out, failed fetch or produce requests, topic activity, and consumer group visibility.
For ACE and integration teams, performance analysis may depend on broker, server, execution group, application, and flow status, along with accounting and flow history such as elapsed time, message counts, thread activity, and flow-level behavior over defined time windows.
For ActiveMQ teams, useful signals may include connection count, producer and consumer count, message count, memory usage, queue count, topic count, durable and persistent message counts, messages acknowledged, messages added, and messages expired or killed.
The point is not to collect every available metric. The point is to monitor the conditions that reveal whether the middleware layer is doing what the business expects it to do.
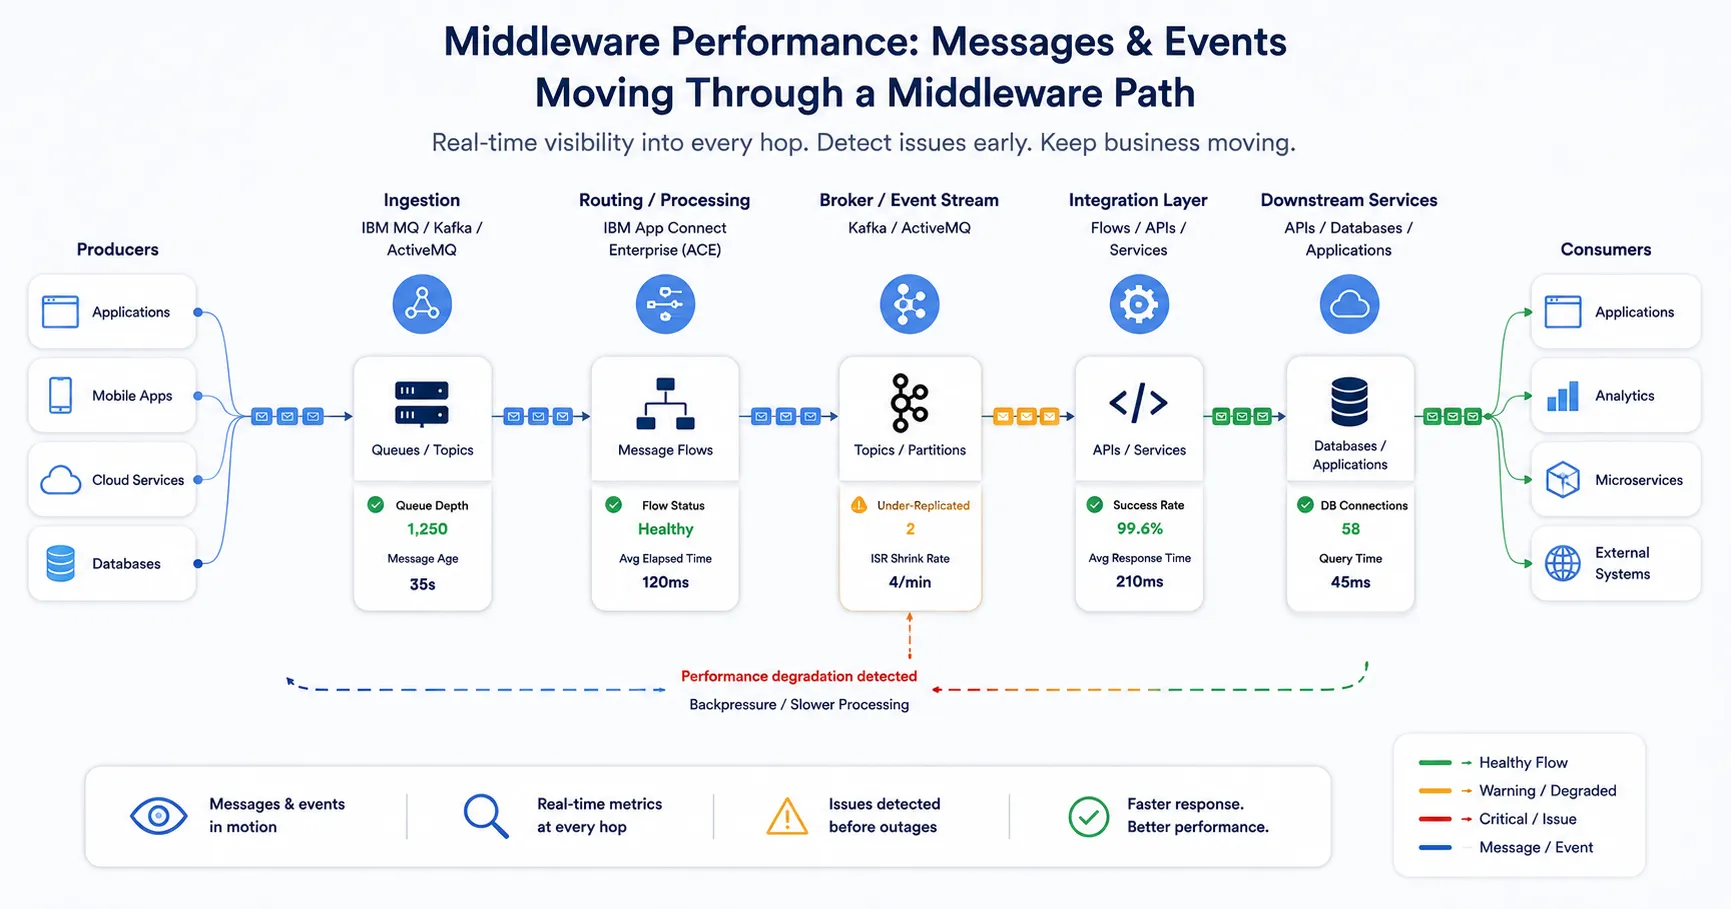
Middleware performance visibility across every hop in the message and event flow path.
Why General Monitoring Often Misses Middleware Performance Issues
General infrastructure tools can identify CPU pressure, memory usage, host availability, and network behavior. Those signals matter, but they rarely provide enough detail to diagnose middleware performance problems quickly.
A middleware administrator may need to know whether a specific queue is backing up, whether a channel is repeatedly retrying, whether messages are getting stale, whether a Kafka topic has abnormal failed produce requests, whether an ACE flow is slowing down, or whether a downstream URL or web service dependency is causing message buildup.
That level of detail requires purpose-built middleware monitoring. It also requires context. A queue depth of 5,000 may be normal for one application and urgent for another. A stopped object may be expected during a maintenance window but critical during business processing. A message backlog may be caused by a consumer problem, a routing issue, a failed downstream service, or a change made by a user with administrative access.
Middleware performance cannot be managed effectively from disconnected views.
The Importance of Unified Monitoring and Management
A common performance-management problem is tool fragmentation. One system identifies an alert. Another system provides historical reporting. A different console is needed to inspect or change the object. A script may be required for corrective action. Another team may need to be contacted because access is restricted.
That workflow adds time, risk, and friction.
A unified middleware monitoring and management solution helps close the gap between detection and action. With Infrared360, teams can monitor, administer, test, audit, report, and analyze middleware environments from a single interface. That matters because the people diagnosing a performance issue often need to take governed action: inspect a queue, review channel status, move or transfer messages, run approved commands, view historical trends, restart authorized objects, or validate whether a dependency is responding.
For senior middleware teams, this is not just convenience. It is operational control.
Where Automation Helps Middleware Performance
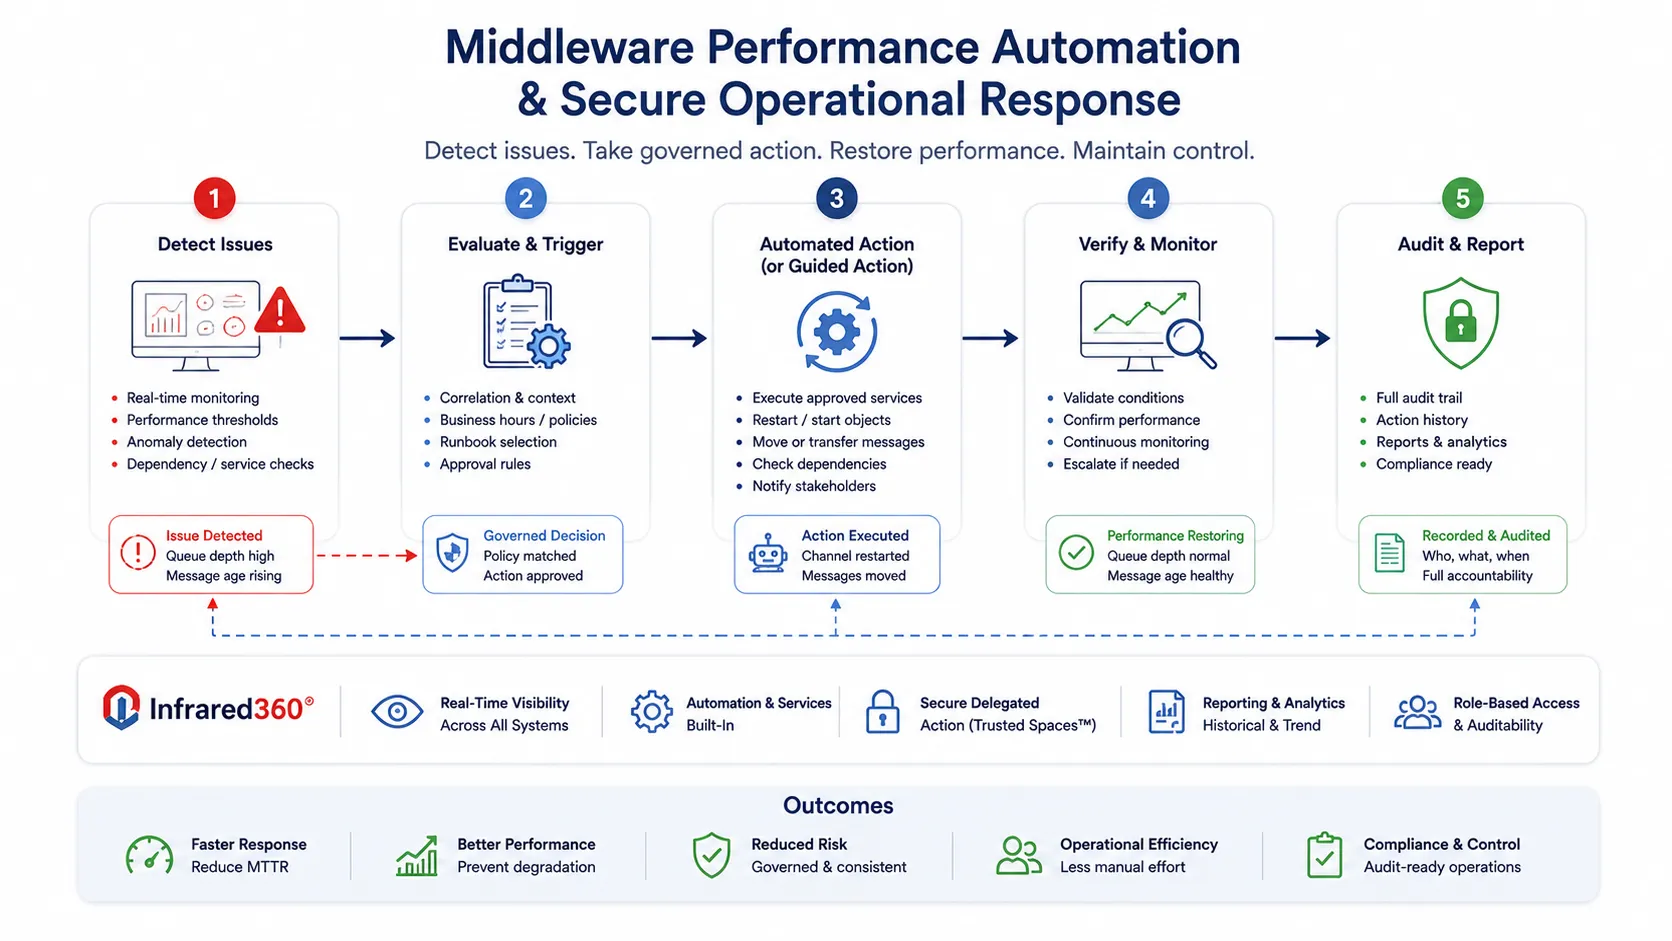
Middleware performance automation and secure operational response across distributed systems, queues, message flows, and services.
Automation is most useful when it handles known, repeatable, well-governed actions that otherwise consume administrator time or delay response. In middleware performance management, that can include alert-triggered actions, scheduled reporting, synthetic transaction testing, service checks, message movement, DLQ handling, or running approved operational services when defined conditions occur.
For example, automation can help when a known queue condition requires a defined notification and service action, when a channel needs an authorized restart, when messages need to be transferred according to a controlled process, or when a URL or SOAP/REST dependency should be checked repeatedly to determine whether an upstream or downstream service is contributing to lag.
Automation should not replace engineering judgment. It should remove repetitive work, enforce consistency, and reduce the time between detection and response.
Infrared360 supports this model by combining real-time monitoring, alert actions, services, reporting, and administrative capabilities within the same governed platform. That allows teams to automate appropriate responses while maintaining visibility, control, and auditability.
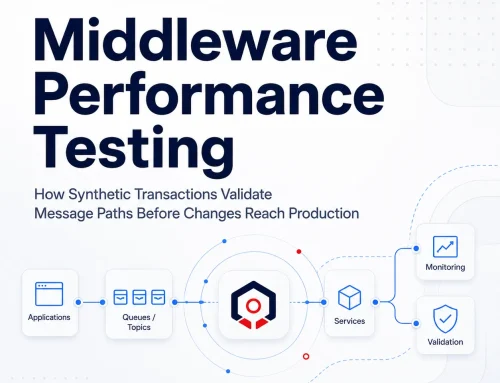
Performance Testing Before Problems Reach Production
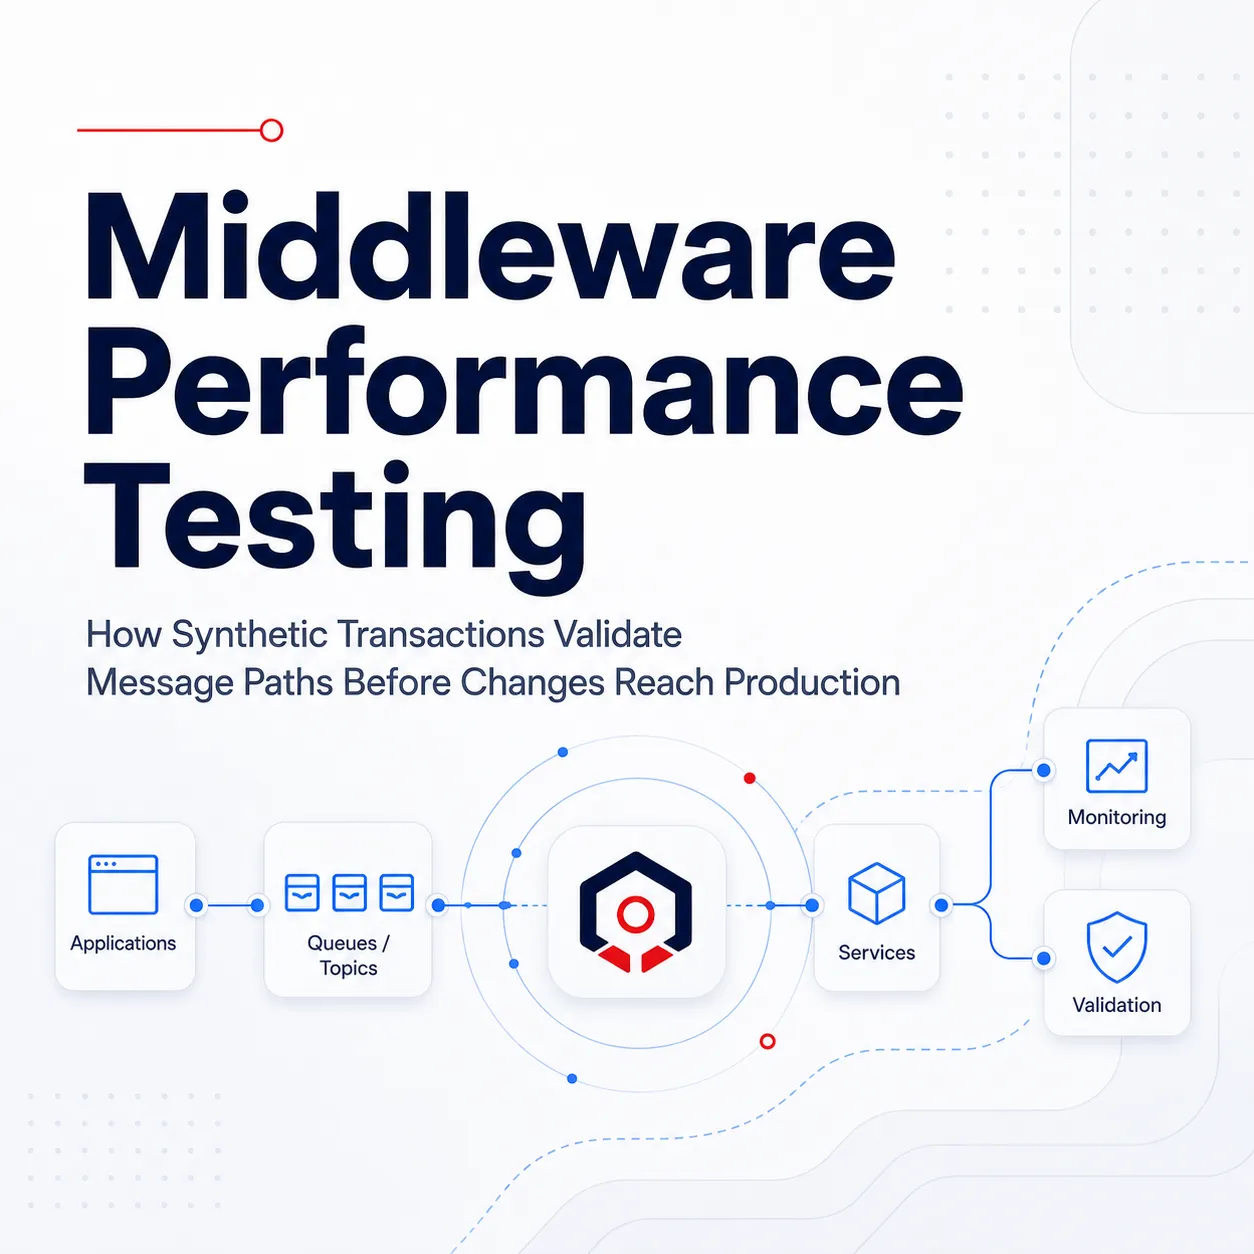
Middleware performance is also improved by testing realistic transaction paths before users or business processes are affected. Synthetic transaction testing can help teams validate routes, message behavior, application dependencies, and performance characteristics using controlled test messages.
Instead of relying only on live traffic or simplistic test messages, teams can use synthetic transactions to generate more realistic scenarios with defined message size, content, headers, formats, timing, and repetition. This can support regression testing, capacity planning, route validation, and proactive detection of issues that might otherwise appear during production processing.
For middleware teams working across MQ, Kafka, ACE, ActiveMQ, and related systems, that kind of testing helps shift performance management from reactive troubleshooting to proactive validation.
Secure Delegated Action Improves Performance Response
Performance problems are often slowed down by organizational boundaries. Application teams may understand the transaction, but not have access to the middleware object. Middleware administrators may control the environment, but not know the application context. Operations may see the alert, but not have authority to act.
Infrared360’s Trusted Spaces™ model helps address this by giving users visibility and permitted actions only for the objects and environments they are authorized to access. That can include queues, topics, consumers, channels, applications, flows, and other middleware resources.
For performance response, this matters. Secure delegated administration allows the right subject matter experts to participate directly without granting broad administrative access. Teams can collaborate faster while still preserving role-based control and audit trails.
Improve Middleware Performance with the Right Assessment
Optimizing middleware performance starts with understanding what you monitor today, what you miss, where alerts create noise, and where teams lose time between detection and resolution.
Avada Software offers a free, no-obligation middleware monitoring assessment to help identify the MQ conditions, thresholds, and alert patterns that matter most in your environment, along with practical recommendations for improving visibility and response
FAQ
Related Posts

More Infrared360® Resources


