

This is Part 6 of a 6-part series exploring how to use IBM MQ as a reliable ingestion layer for AI and RAG.
For the full article, click here | Previous Article
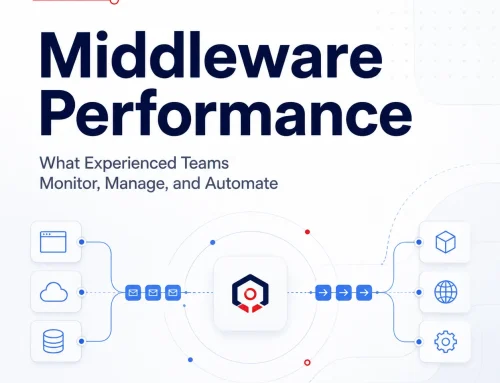
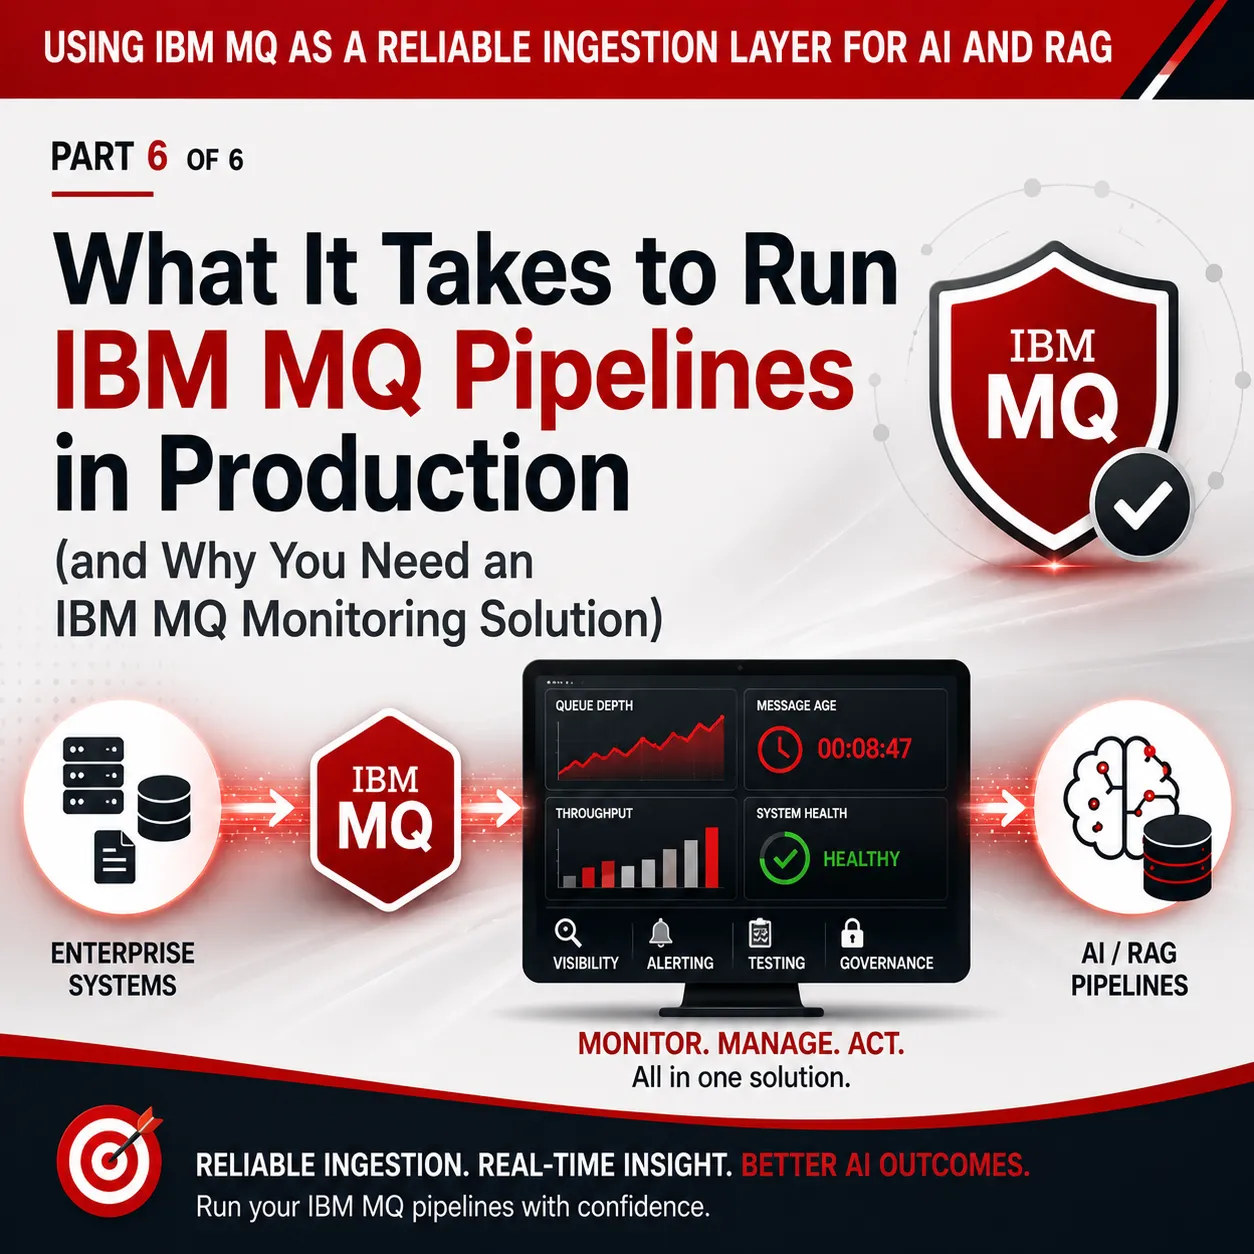
What It Takes to Run IBM MQ Pipelines in Production (and Why You Need an IBM MQ Monitoring Solution)
Running IBM MQ in production has always required discipline.
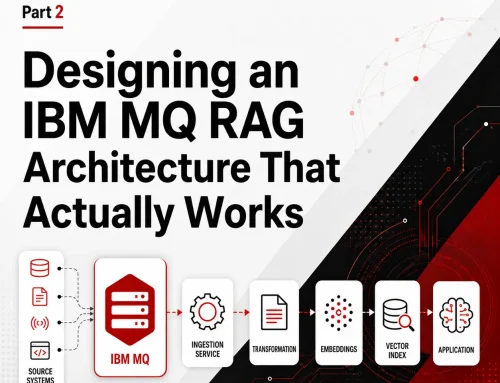
But when MQ becomes part of AI and RAG pipelines, the expectations change. Message flow is no longer just about delivering data between systems. It becomes part of a larger pipeline that directly impacts data freshness, AI accuracy, and downstream decision-making.
That means production readiness is not just about uptime. It is about visibility, control, testing, and coordination across teams.
Production MQ is not just about message delivery
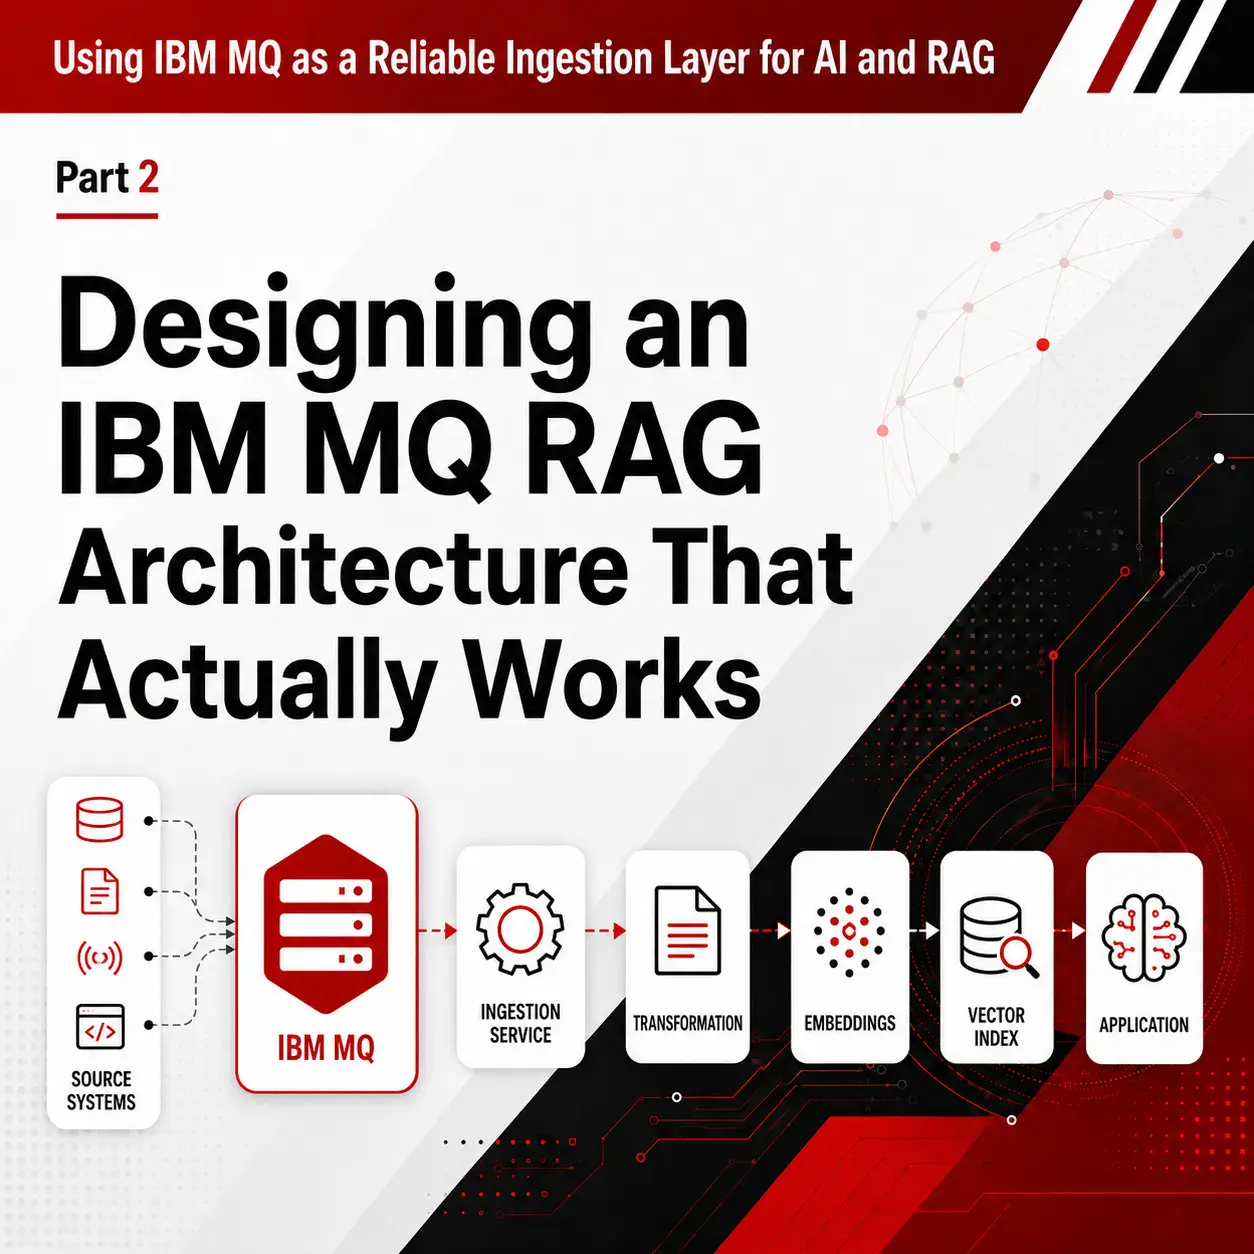
Across this series, we’ve looked at how MQ fits into AI ingestion pipelines.
We’ve covered:
- how MQ acts as a reliable ingestion layer
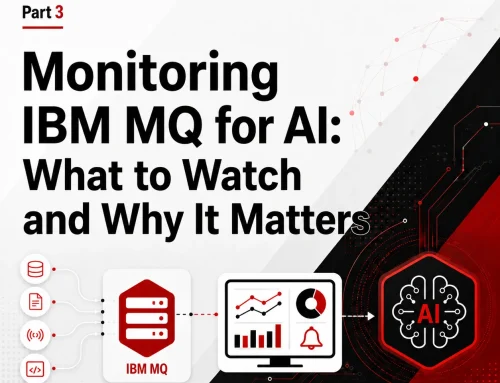
- why monitoring needs to go beyond basic metrics
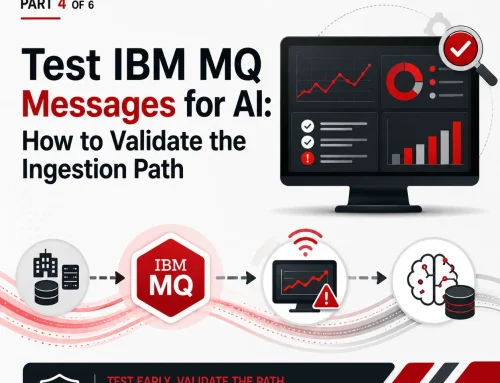
- how testing must validate realistic message behavior
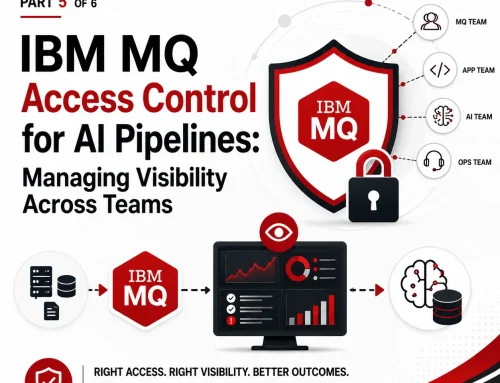
- why governance and access control matter across teams
Each of these areas addresses a different challenge.
In production, they all come together.
What actually breaks in production environments
When MQ pipelines are not fully operationalized, issues tend to show up in predictable ways:
- queue depth grows without clear cause
- message age increases unnoticed
- consumers fall behind under load
- downstream systems slow or fail silently
- teams lack visibility into the same data
- troubleshooting takes longer than it should
These are not theoretical problems. They are the day-to-day realities of running distributed systems.
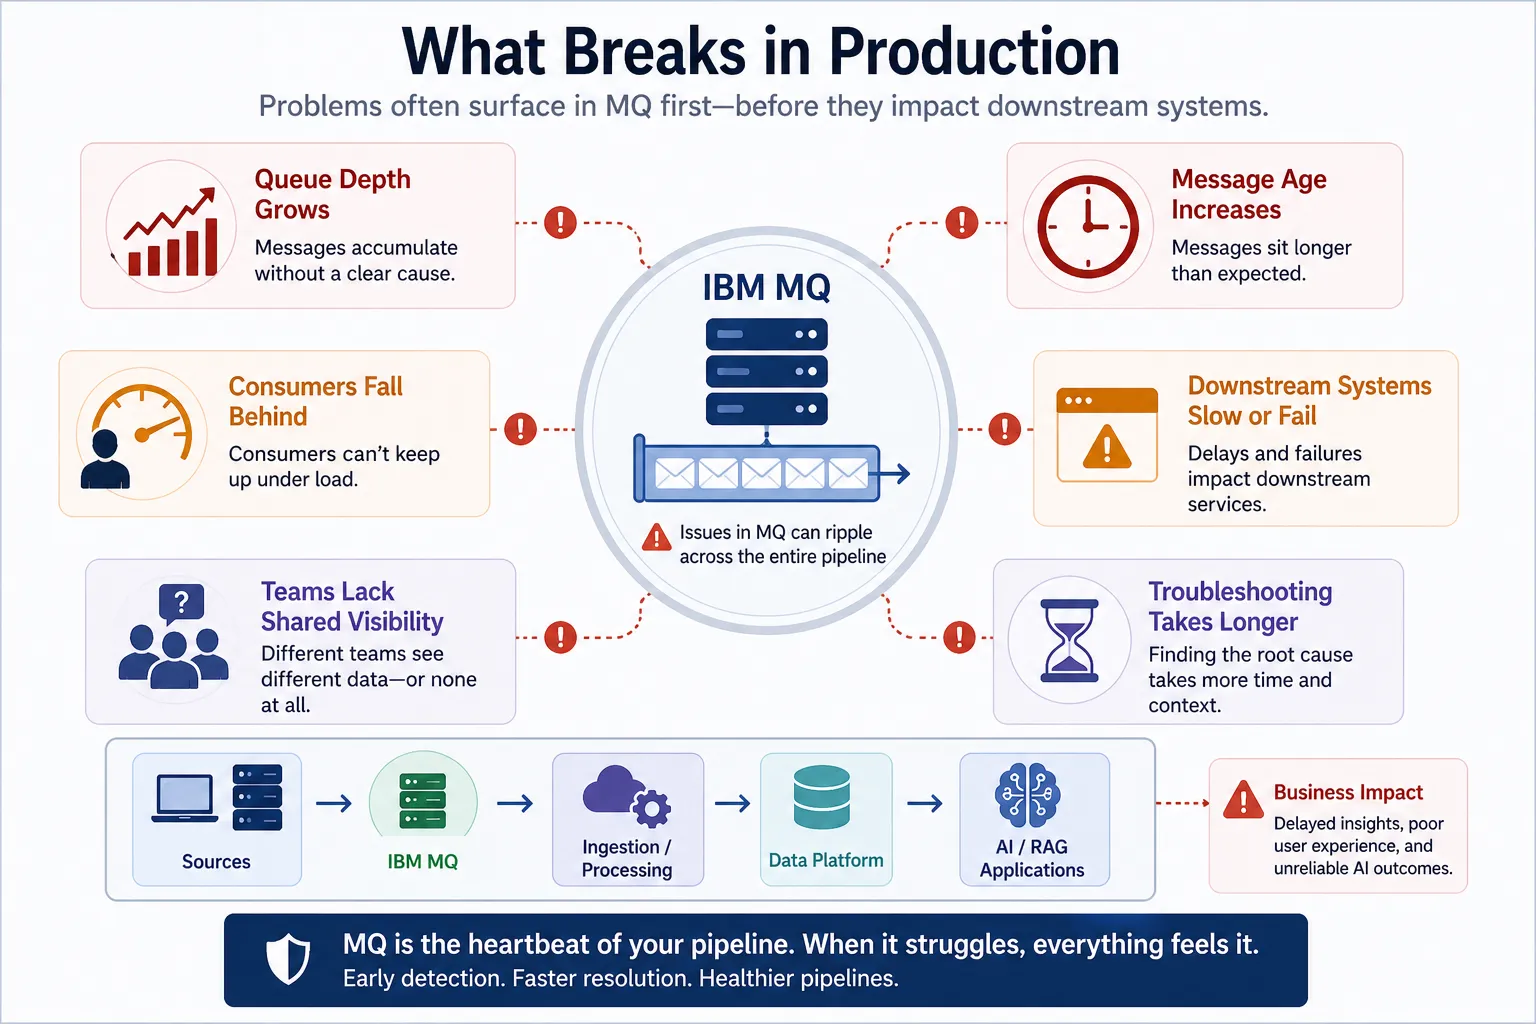
IBM MQ production issues often surface first as queue depth, message age, consumer delays, or visibility gaps before they impact downstream AI systems.
What production-ready MQ really requires
To operate MQ pipelines effectively—especially in AI-driven environments—teams need more than basic tooling.
They need a combination of:
Visibility
Real-time insight into queue depth, message age, rates, and system health across environments.
Monitoring
Alerting based on meaningful conditions, not just static thresholds.
Testing
Repeatable validation of message flow, routing, payloads, and volume.
Governance
Controlled access and shared visibility across teams without increasing risk.
These are not separate concerns. They work together.
Why point solutions fall short
Many organizations rely on a mix of tools:
- native MQ commands
- scripts
- separate monitoring tools
- manual testing processes
- disconnected dashboards
Each tool may solve part of the problem.
But in production, fragmentation creates gaps:
- data is not centralized
- teams see different views of the system
- alerts lack context
- testing is inconsistent
- access control is hard to manage
The result is slower response and higher operational risk.
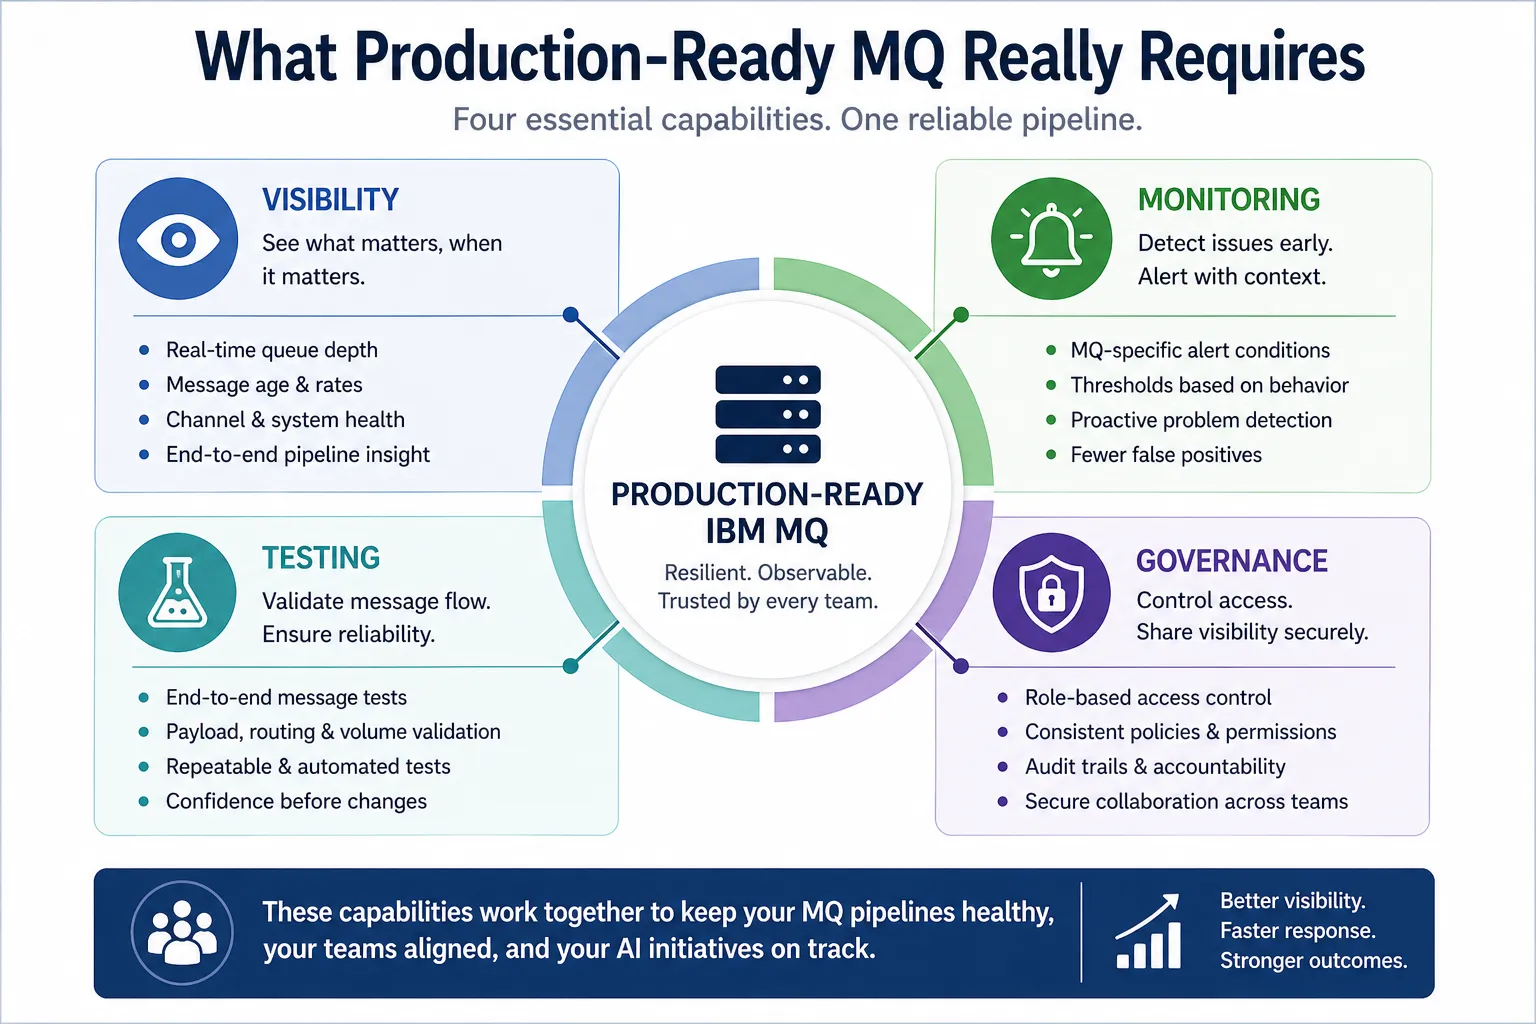
Production-ready IBM MQ requires visibility, monitoring, testing, and governance working together to keep AI and RAG pipelines reliable.
Where an IBM MQ monitoring solution makes the difference
This is where a purpose-built IBM MQ monitoring solution becomes important.
General observability platforms and infrastructure monitoring tools can provide useful insights into system health, host performance, and application behavior. Many also offer MQ integrations or add-ons that expose basic metrics such as queue depth or channel status.
But when MQ is used as a core ingestion layer—especially for AI pipelines—the operational requirements go deeper.
Teams are not just monitoring infrastructure. They are monitoring message behavior.
That includes:
- how messages move through queues over time
- how quickly they are consumed under varying load conditions
- how message age changes as downstream systems slow or recover
- how routing and queue relationships affect delivery
- how message characteristics (headers, properties, payload structure) impact downstream processing
These are MQ-specific behaviors that directly affect how data flows into AI systems.
In AI ingestion pipelines, this matters because MQ is often the first place where downstream problems become visible. A slowdown in an ingestion service, embedding API, or processing pipeline may not immediately surface in infrastructure metrics, but it often shows up as increasing queue depth, rising message age, or changing consumption patterns.
A monitoring solution designed specifically for IBM MQ is built to surface and interpret these MQ-level signals in a way that aligns with how MQ actually operates.
Just as importantly, effective operations require more than visibility.
When issues are detected, teams need a practical way to respond—whether that means investigating message flow, adjusting configurations, clearing or rerouting messages, or triggering predefined actions.
If monitoring, management, and response are handled across separate tools, that introduces delays, context switching, and coordination overhead at the exact moment when time matters most.
A more effective approach brings these capabilities together so teams can:
- monitor MQ activity and message behavior in real time
- define meaningful alert conditions based on MQ-specific patterns
- take controlled action within the same operational context
- automate repeatable responses where appropriate
- adjust configurations or workflows when needed
- provide role-based visibility across teams
This does not replace broader observability platforms. Those still provide valuable system-level insight.
But in environments where MQ is a critical part of the data pipeline—especially for AI ingestion—a purpose-built IBM MQ monitoring solution that also supports operational control helps teams move from simply detecting issues to resolving them more quickly and consistently.
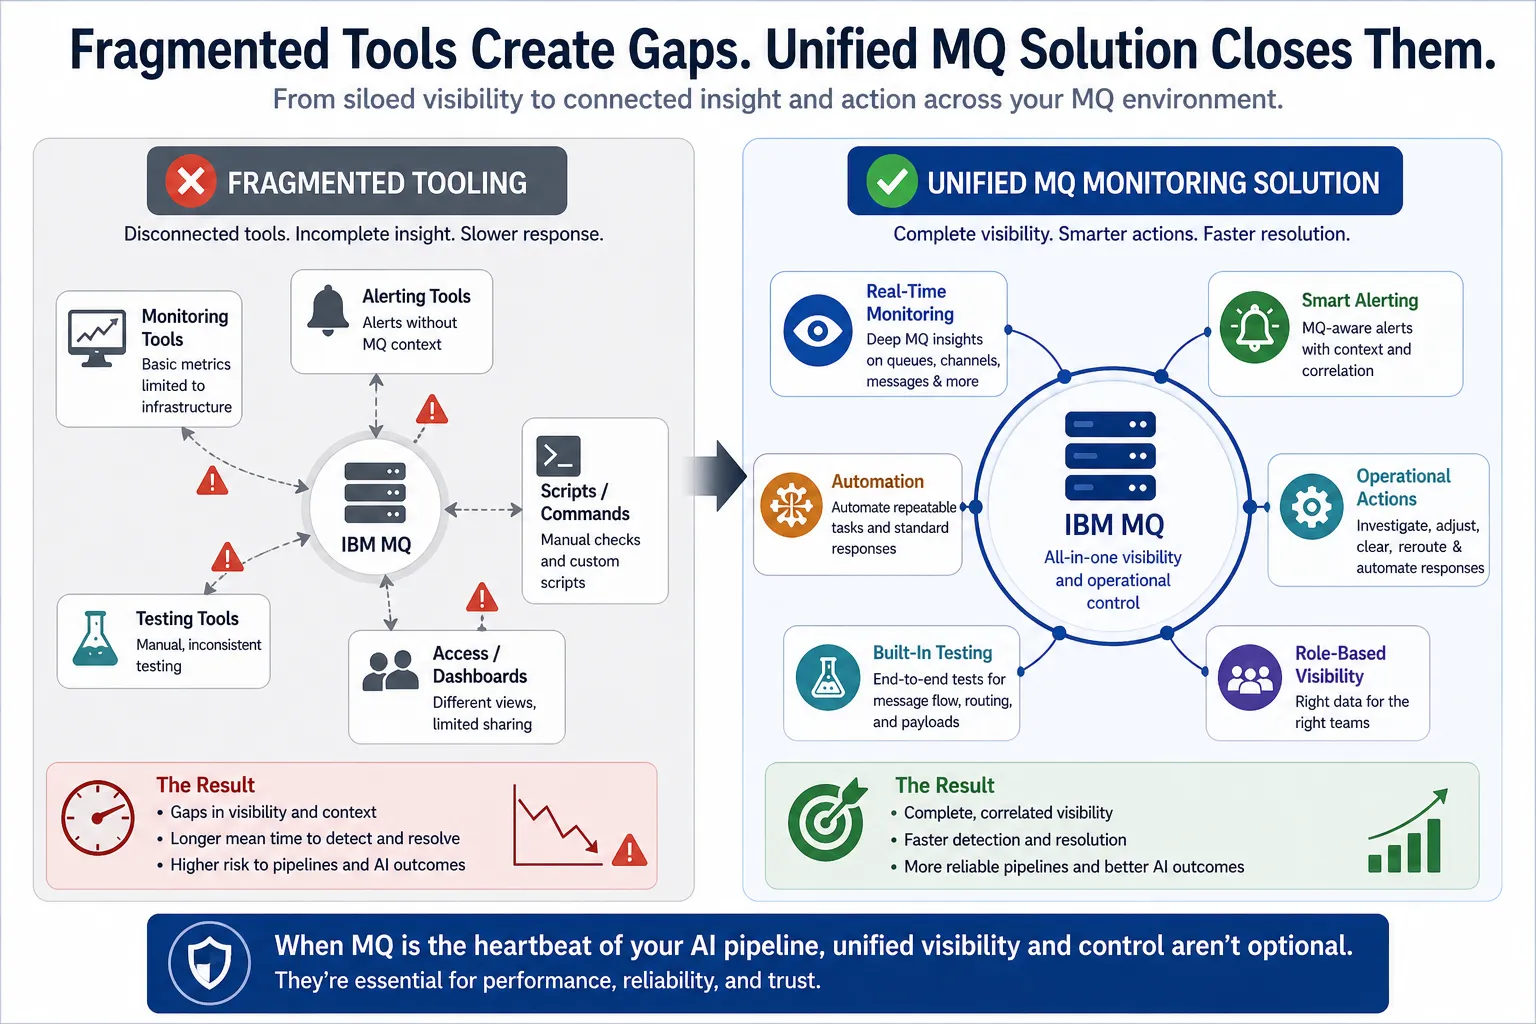
A unified IBM MQ monitoring solution helps close visibility gaps, reduce response time, and improve reliability across AI and RAG pipelines.
Key takeaways
- Running IBM MQ in production requires more than ensuring message delivery
- Monitoring, testing, visibility, and governance must work together
- AI pipelines increase the impact of delays and operational gaps
- Fragmented tools create blind spots and slow response
- A unified IBM MQ monitoring solution helps teams operate more effectively
This is Part 6 of a 6-part series exploring how to use IBM MQ as a reliable ingestion layer for AI and RAG.
For the full article, click here | Previous Article
Related Posts
More Infrared360® Resources


