

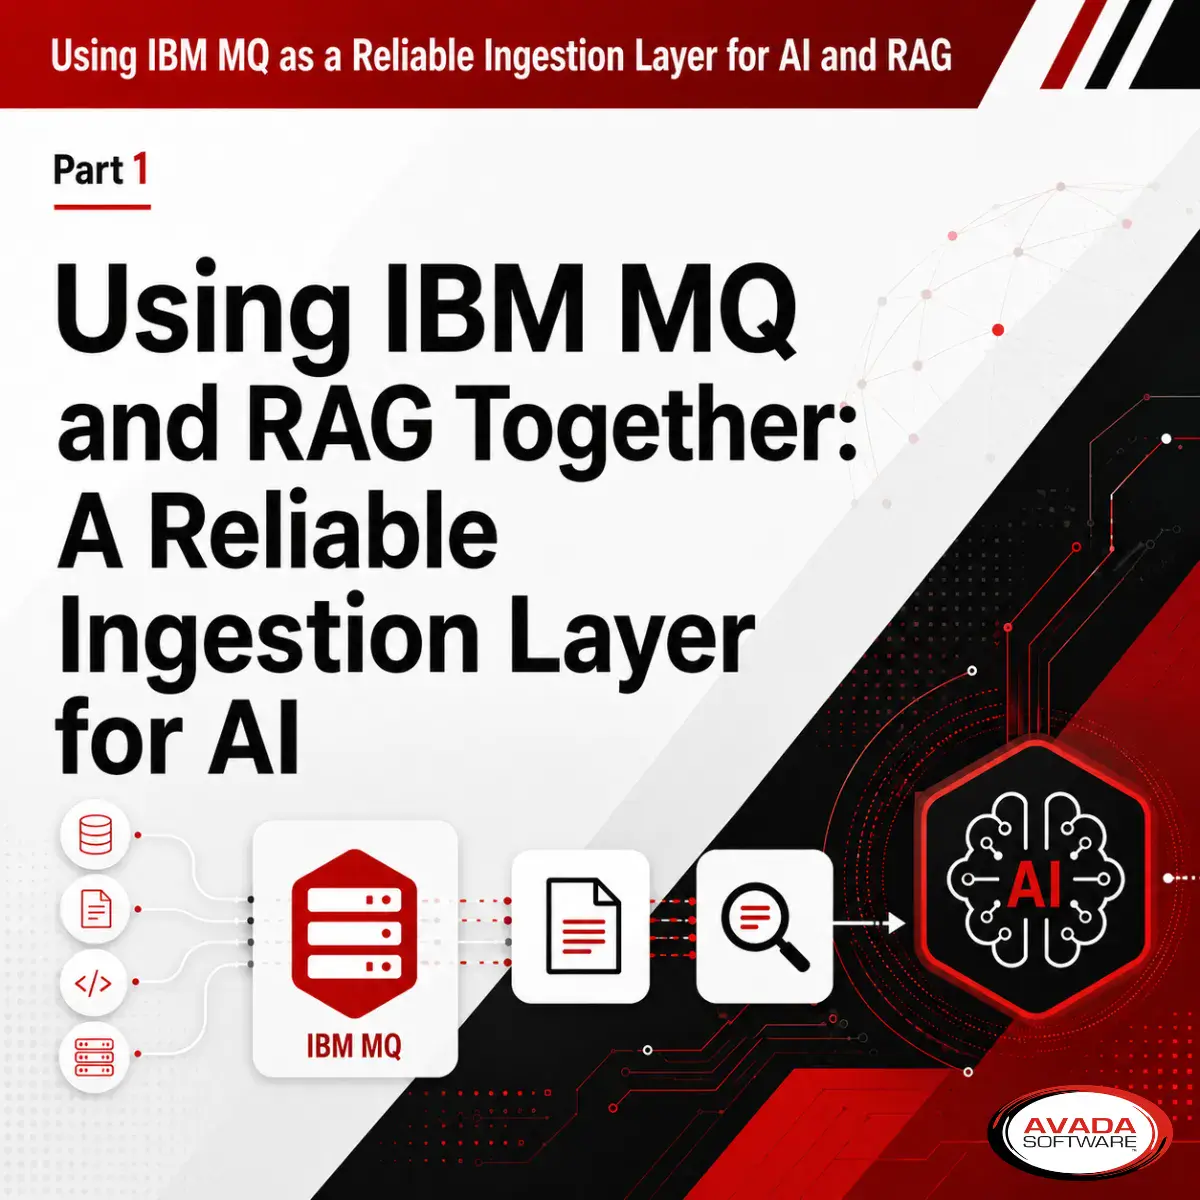
This is Part 3 of a 6-part series exploring how to use IBM MQ as a reliable ingestion layer for AI and RAG.
For the full article, click here | Previous Article | Next Article
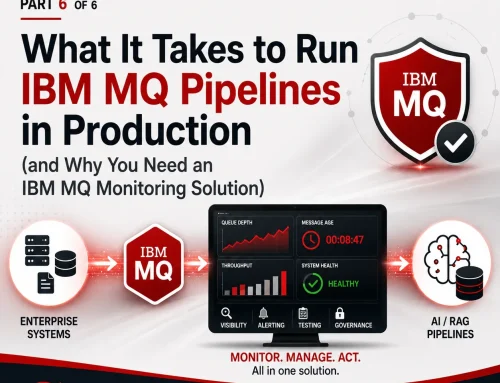
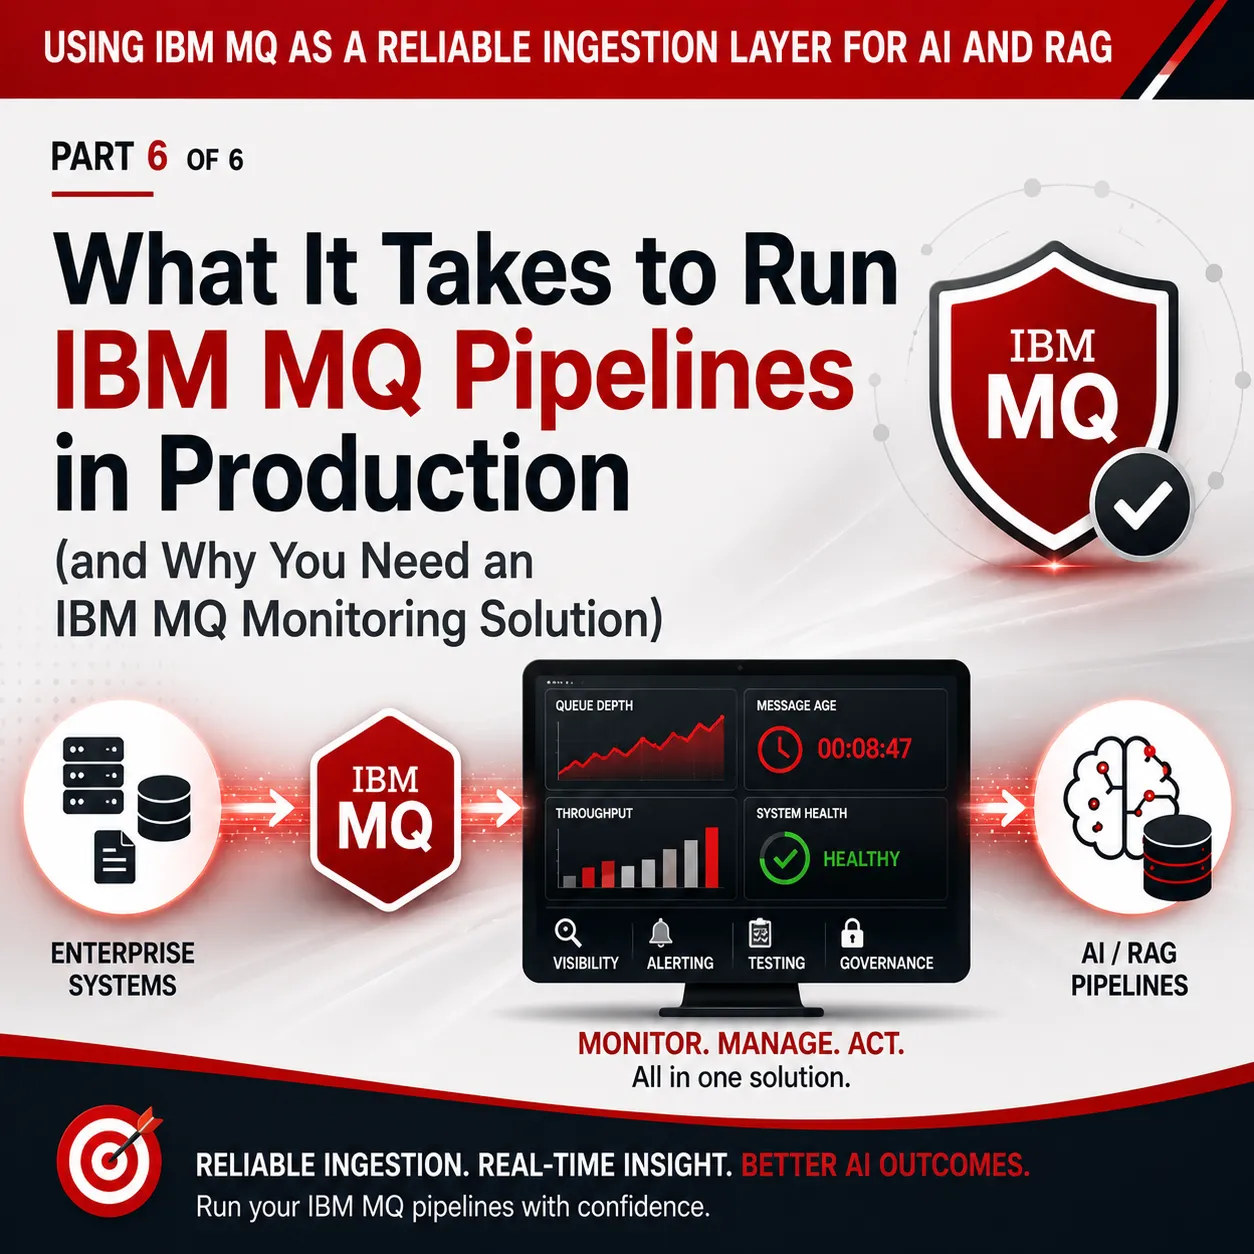
Monitoring IBM MQ for AI: What to Watch and Why It Matters
When IBM MQ becomes part of an AI pipeline, monitoring does not get simpler. It becomes more important—and more complex.
In traditional MQ environments, teams focus on message flow, queue health, and system availability. Those fundamentals still matter. But when MQ feeds downstream AI or RAG pipelines, the impact of a problem extends beyond MQ itself.
A queue can look healthy while the AI pipeline is delayed, incomplete, or failing silently.
That is why monitoring IBM MQ for AI requires a broader, more intentional approach
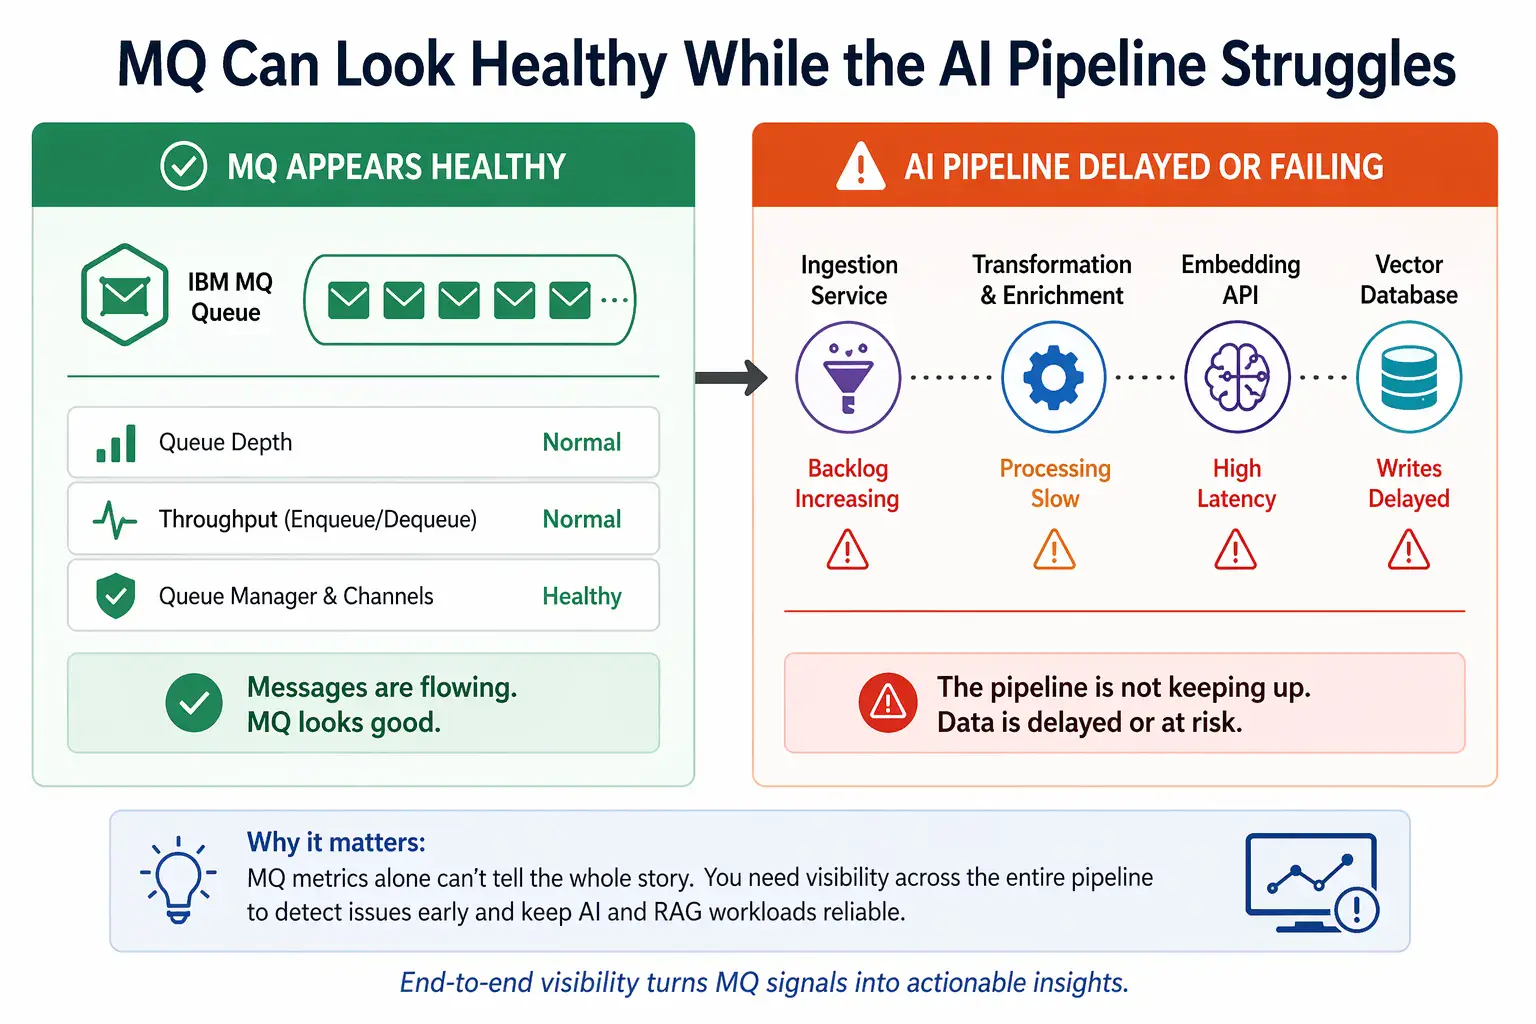
MQ can appear healthy while downstream AI pipelines are delayed or failing
What changes when MQ feeds AI pipelines
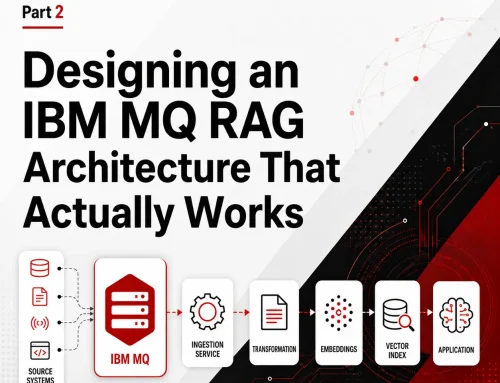
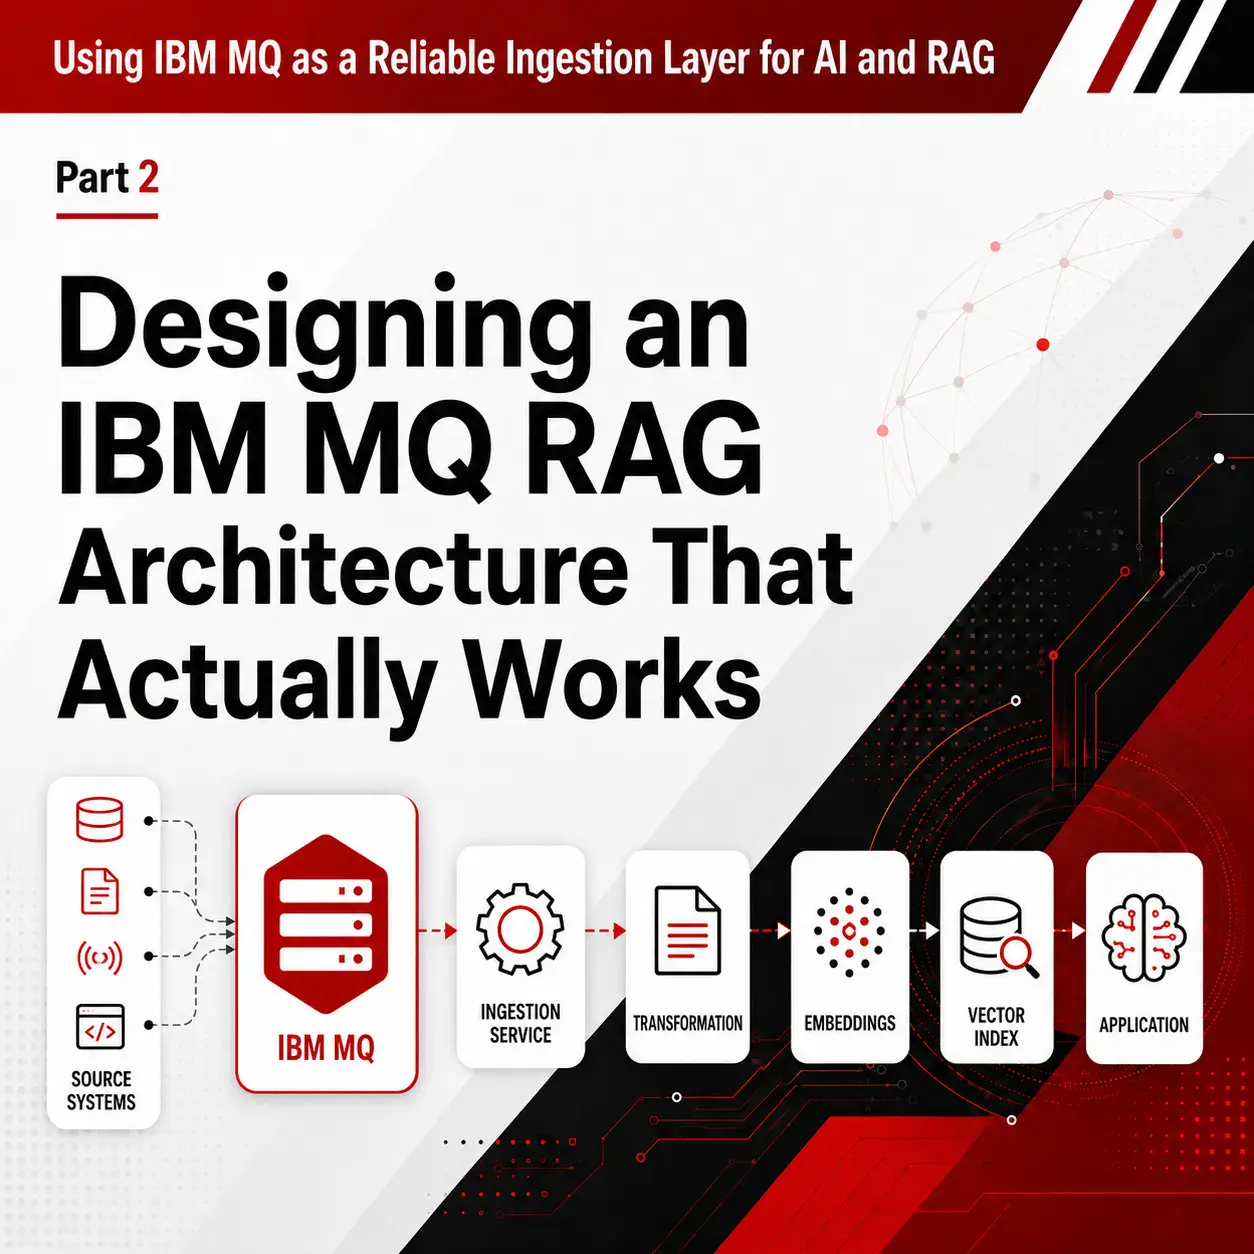
In a typical MQ-to-AI architecture, messages do not stop at a consuming application. They move through a pipeline that may include:
- ingestion services
- transformation and enrichment steps
- embedding APIs
- vector indexes or databases
Each of these introduces new dependencies—and new failure points.
That means MQ monitoring must answer more than:
- “Are messages moving?”
It must also help answer:
- “Are messages being consumed at the right rate?”
- “Is the pipeline keeping up with incoming volume?”
- “Are downstream systems causing lag or backlog?”
Core MQ metrics that still matter
The fundamentals of MQ monitoring do not go away. In fact, they become more important as early indicators of downstream issues.
Key metrics include:
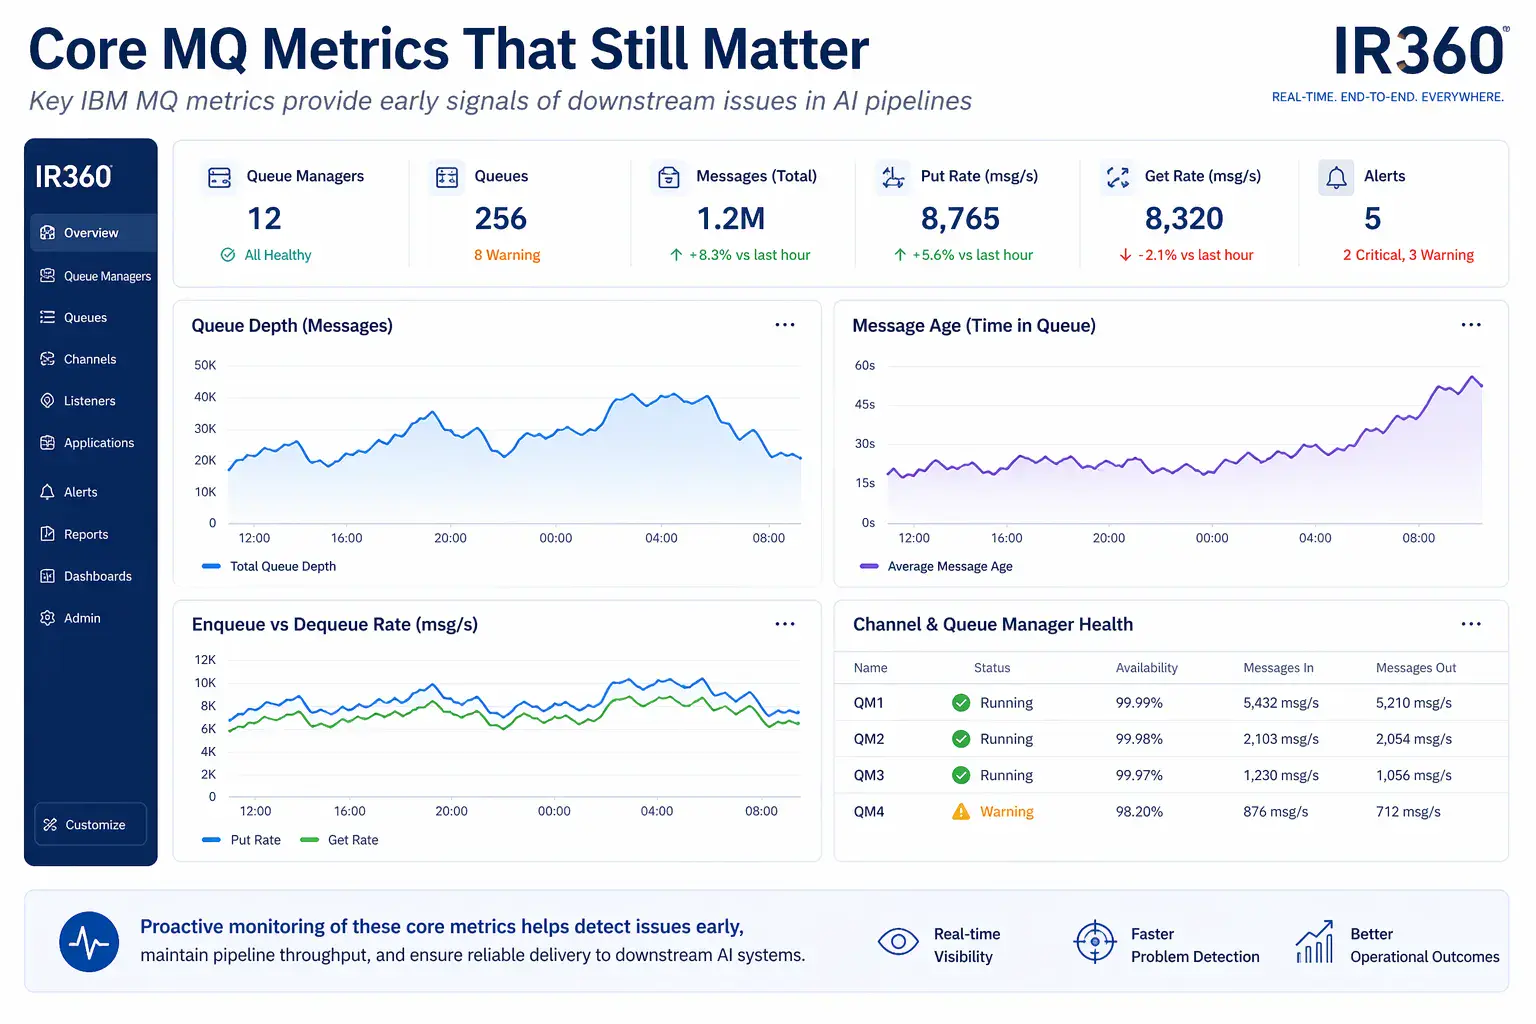
Core MQ metrics provide early signals of downstream issues in AI pipelines.
Queue depth
Rising queue depth can indicate:
- slow consumers
- downstream processing delays
- ingestion bottlenecks
Message age
One of the most important signals in AI ingestion pipelines.
Increasing message age often means:
- messages are waiting too long to be processed
- downstream systems are lagging
Enqueue and dequeue rates
Comparing these rates helps identify:
- whether the system is keeping up
- whether backlog is forming
Channel and queue manager health
These remain essential for ensuring:
- connectivity
- stability
- throughput
What to look for beyond MQ
This is where monitoring IBM MQ for AI becomes different.
Problems often appear outside MQ, but are first visible inside MQ.
For example:
- Queue depth increases because an embedding API is slow
- Message age rises because ingestion services are backlogged
- Dequeue rate drops due to downstream processing failures
Without visibility into these relationships, teams can misdiagnose issues as “MQ problems” when they are not.
Alerting: what experienced MQ teams actually watch
Simple threshold alerts are rarely enough on their own. When monitoring IBM MQ for AI, experienced MQ teams look for patterns that show whether message flow is healthy, whether consumers are keeping up, and whether delays are starting to build before they become outages.
For AI and RAG ingestion pipelines, the most useful alerts often combine multiple MQ-side conditions, such as:
- Queue depth increasing while enqueue rate remains steady → the downstream path may not be keeping up.
- Message age increasing despite active consumers → messages are being picked up too slowly or downstream processing is delaying completion.
- Dequeue rate dropping while messages continue arriving → the consumer, ingestion service, or downstream process may be slowing down.
- No recent gets while messages are accumulating → the consumer may be stopped, disconnected, blocked, or failing.
- Frequent depth spikes after normal processing periods → intermittent bottlenecks may be appearing downstream.
- Backout or retry patterns increasing → messages may be failing repeatedly and slowing the ingestion path.
- Uncommitted messages rising or remaining elevated → processing may be stuck before completion or commit.
- Queue depth high + message age high → the backlog is not just growing; messages are waiting too long to be useful.
These are the kinds of conditions that often point to issues outside MQ itself, such as slow ingestion services, API latency, downstream processing delays, or consumer-side bottlenecks. Monitoring MQ effectively in these cases means recognizing these patterns early and correlating them with dependent systems.
Why end-to-end visibility matters
Monitoring IBM MQ for AI is not just about watching MQ.
It is about understanding how MQ fits into the broader system.
Without that context:
- teams react too late
- root cause analysis takes longer
- issues appear in downstream systems first
With the right visibility:
- backlogs are detected early
- dependencies are understood
- response time improves
Where monitoring capabilities make the difference
In these environments, monitoring tools need to do more than report basic MQ object status. When IBM MQ feeds an AI or RAG pipeline, the operational question is not only whether MQ is available. It is whether messages are moving at the expected pace, whether the ingestion path is keeping up, whether delays are building, and whether the right teams can see and respond to problems before they affect downstream systems.
That is why teams benefit from monitoring capabilities such as:
- Real-time visibility across queues and environments
AI ingestion pipelines can depend on multiple queues, queue managers, and environments. Real-time visibility helps teams see message buildup, message age, consumption patterns, and queue health before small delays turn into larger operational issues. - Correlation between MQ metrics and downstream behavior
MQ often shows the first visible symptoms of problems that originate elsewhere. Rising message age, falling dequeue rates, or depth spikes may point to slow consumers, ingestion bottlenecks, or downstream processing delays. The more easily teams can connect MQ behavior to the surrounding pipeline, the faster they can narrow the problem. - Flexible alerting based on combined conditions
A single threshold is often too blunt. Queue depth alone may not be enough, especially during expected bursts. More useful alerts combine conditions such as depth, age, enqueue/dequeue rates, last get activity, backout patterns, or uncommitted messages so teams can distinguish normal workload variation from a real problem. - Role-based access for cross-team visibility
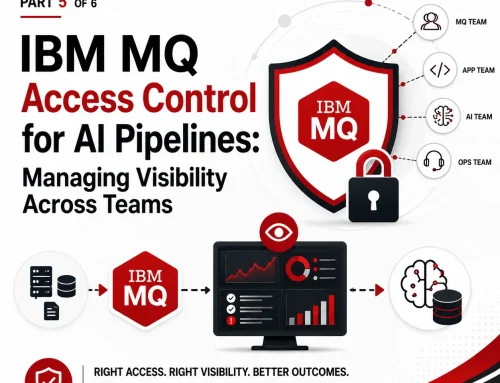
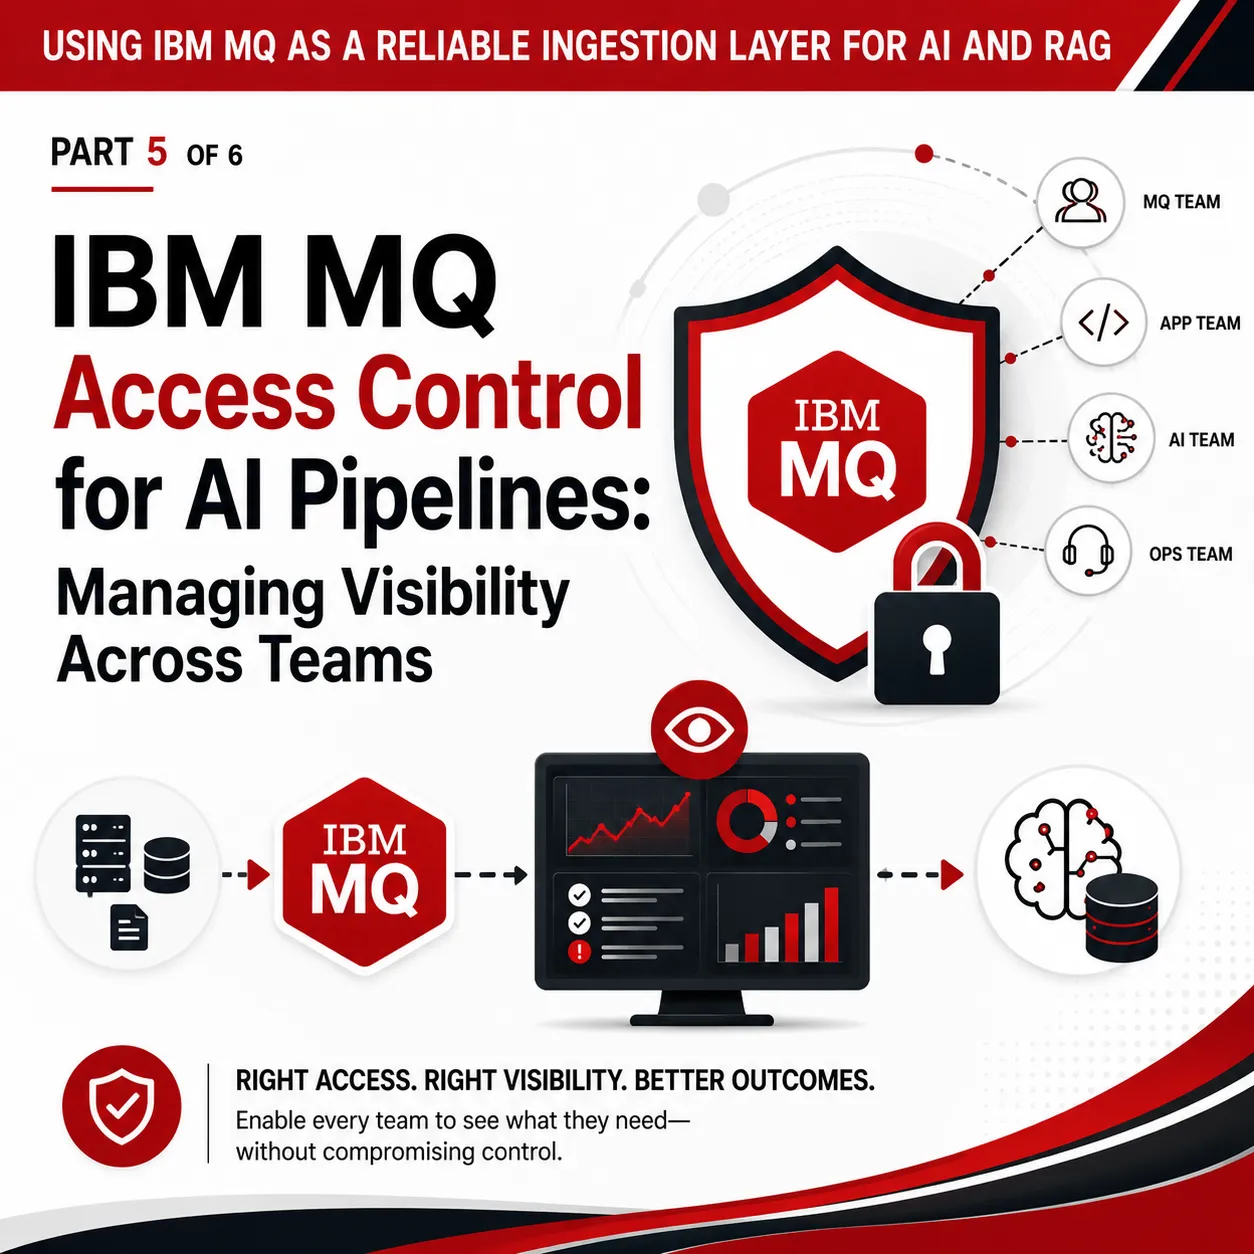
AI ingestion pipelines often involve middleware teams, application owners, integration engineers, and operations staff. Each group may need visibility into part of the flow, but not unrestricted access to the entire MQ estate. Role-based access helps teams collaborate without overexposing sensitive systems or granting unnecessary authority. - Dashboards that show system health at a glance
Dashboards matter because they reduce time to understanding. A good dashboard can show queue depth, message age, enqueue/dequeue trends, alerts, and related health indicators in one place, helping teams quickly see whether the pipeline is healthy, lagging, or beginning to fail.
Together, these capabilities help teams move from reactive troubleshooting to proactive operations. Instead of waiting for users or downstream teams to report that an AI workflow is stale or incomplete, middleware teams can identify early warning signs in MQ, understand what those signals may mean, and act before small issues become business-impacting problems.
This is Part 3 of a 6-part series exploring how to use IBM MQ as a reliable ingestion layer for AI and RAG.
For the full article, click here | Previous Article | Next Article
Related Posts
More Infrared360® Resources


