Mainframe Middleware Monitoring: How to Break the Silo
Your distributed dashboard shows “All Green.”
The web servers are humming. The cloud load balancers are stable. The API gateway is responsive.
But the support tickets are piling up. Customers can’t complete transactions.
The culprit? A full queue running on the z/OS backend.
For decades, the mainframe has been the “Black Box” of enterprise IT. It is a siloed powerhouse that modern SRE teams can’t see into. When a slowdown happens, the “War Room” call turns into a blame game. Distributed teams blame the network, and Mainframe teams (Sysprogs) say, “The LPAR is fine—CPU and WLM look normal.”
You don’t have to leave the mainframe in a silo. To achieve true situational awareness, you must bring z/OS metrics into your modern distributed dashboard.
In this article, “mainframe middleware” means middleware running on z/OS (for example IBM MQ for z/OS and related integration components), not z/OS platform subsystems like security, workload management, or JES. This guide covers the essentials of Mainframe Middleware Monitoring. We will show you how to bridge the gap between legacy reliability and modern agility without overcomplicating your infrastructure.
Why Mainframe Middleware Monitoring is the Enterprise “Blind Spot”
In a hybrid banking or insurance environment, a critical business service often hops across multiple environments:
- It starts at a mobile app (Cloud).
- It hits a payment gateway (On-Prem).
- It lands on the core ledger (Mainframe).
Most generic infrastructure monitoring tools (like Datadog, SolarWinds, or generic APM) are good at the first two hops. They monitor the host: CPU usage, memory, and disk space.
But monitoring the host is not monitoring the middleware.
- Server Monitoring tells you the z/OS LPAR is up and running.
- Middleware Monitoring tells you that the CICS Transaction Gateway is rejecting requests or that a specific IBM MQ channel is “Retrying.”
If your monitoring strategy stops at the server edge, you are effectively flying blind for the most critical 33% of the transaction lifecycle.
The Barrier of “Arcane” Interfaces
Why is this blind spot so persistent? As expert David Corbett noted in his analysis of Viewing, Supporting, and Securing an IBM MQ Environment On Z/OS, the traditional “Green Screen” interface (ISPF) is often “arcane and uninviting” to modern IT professionals.
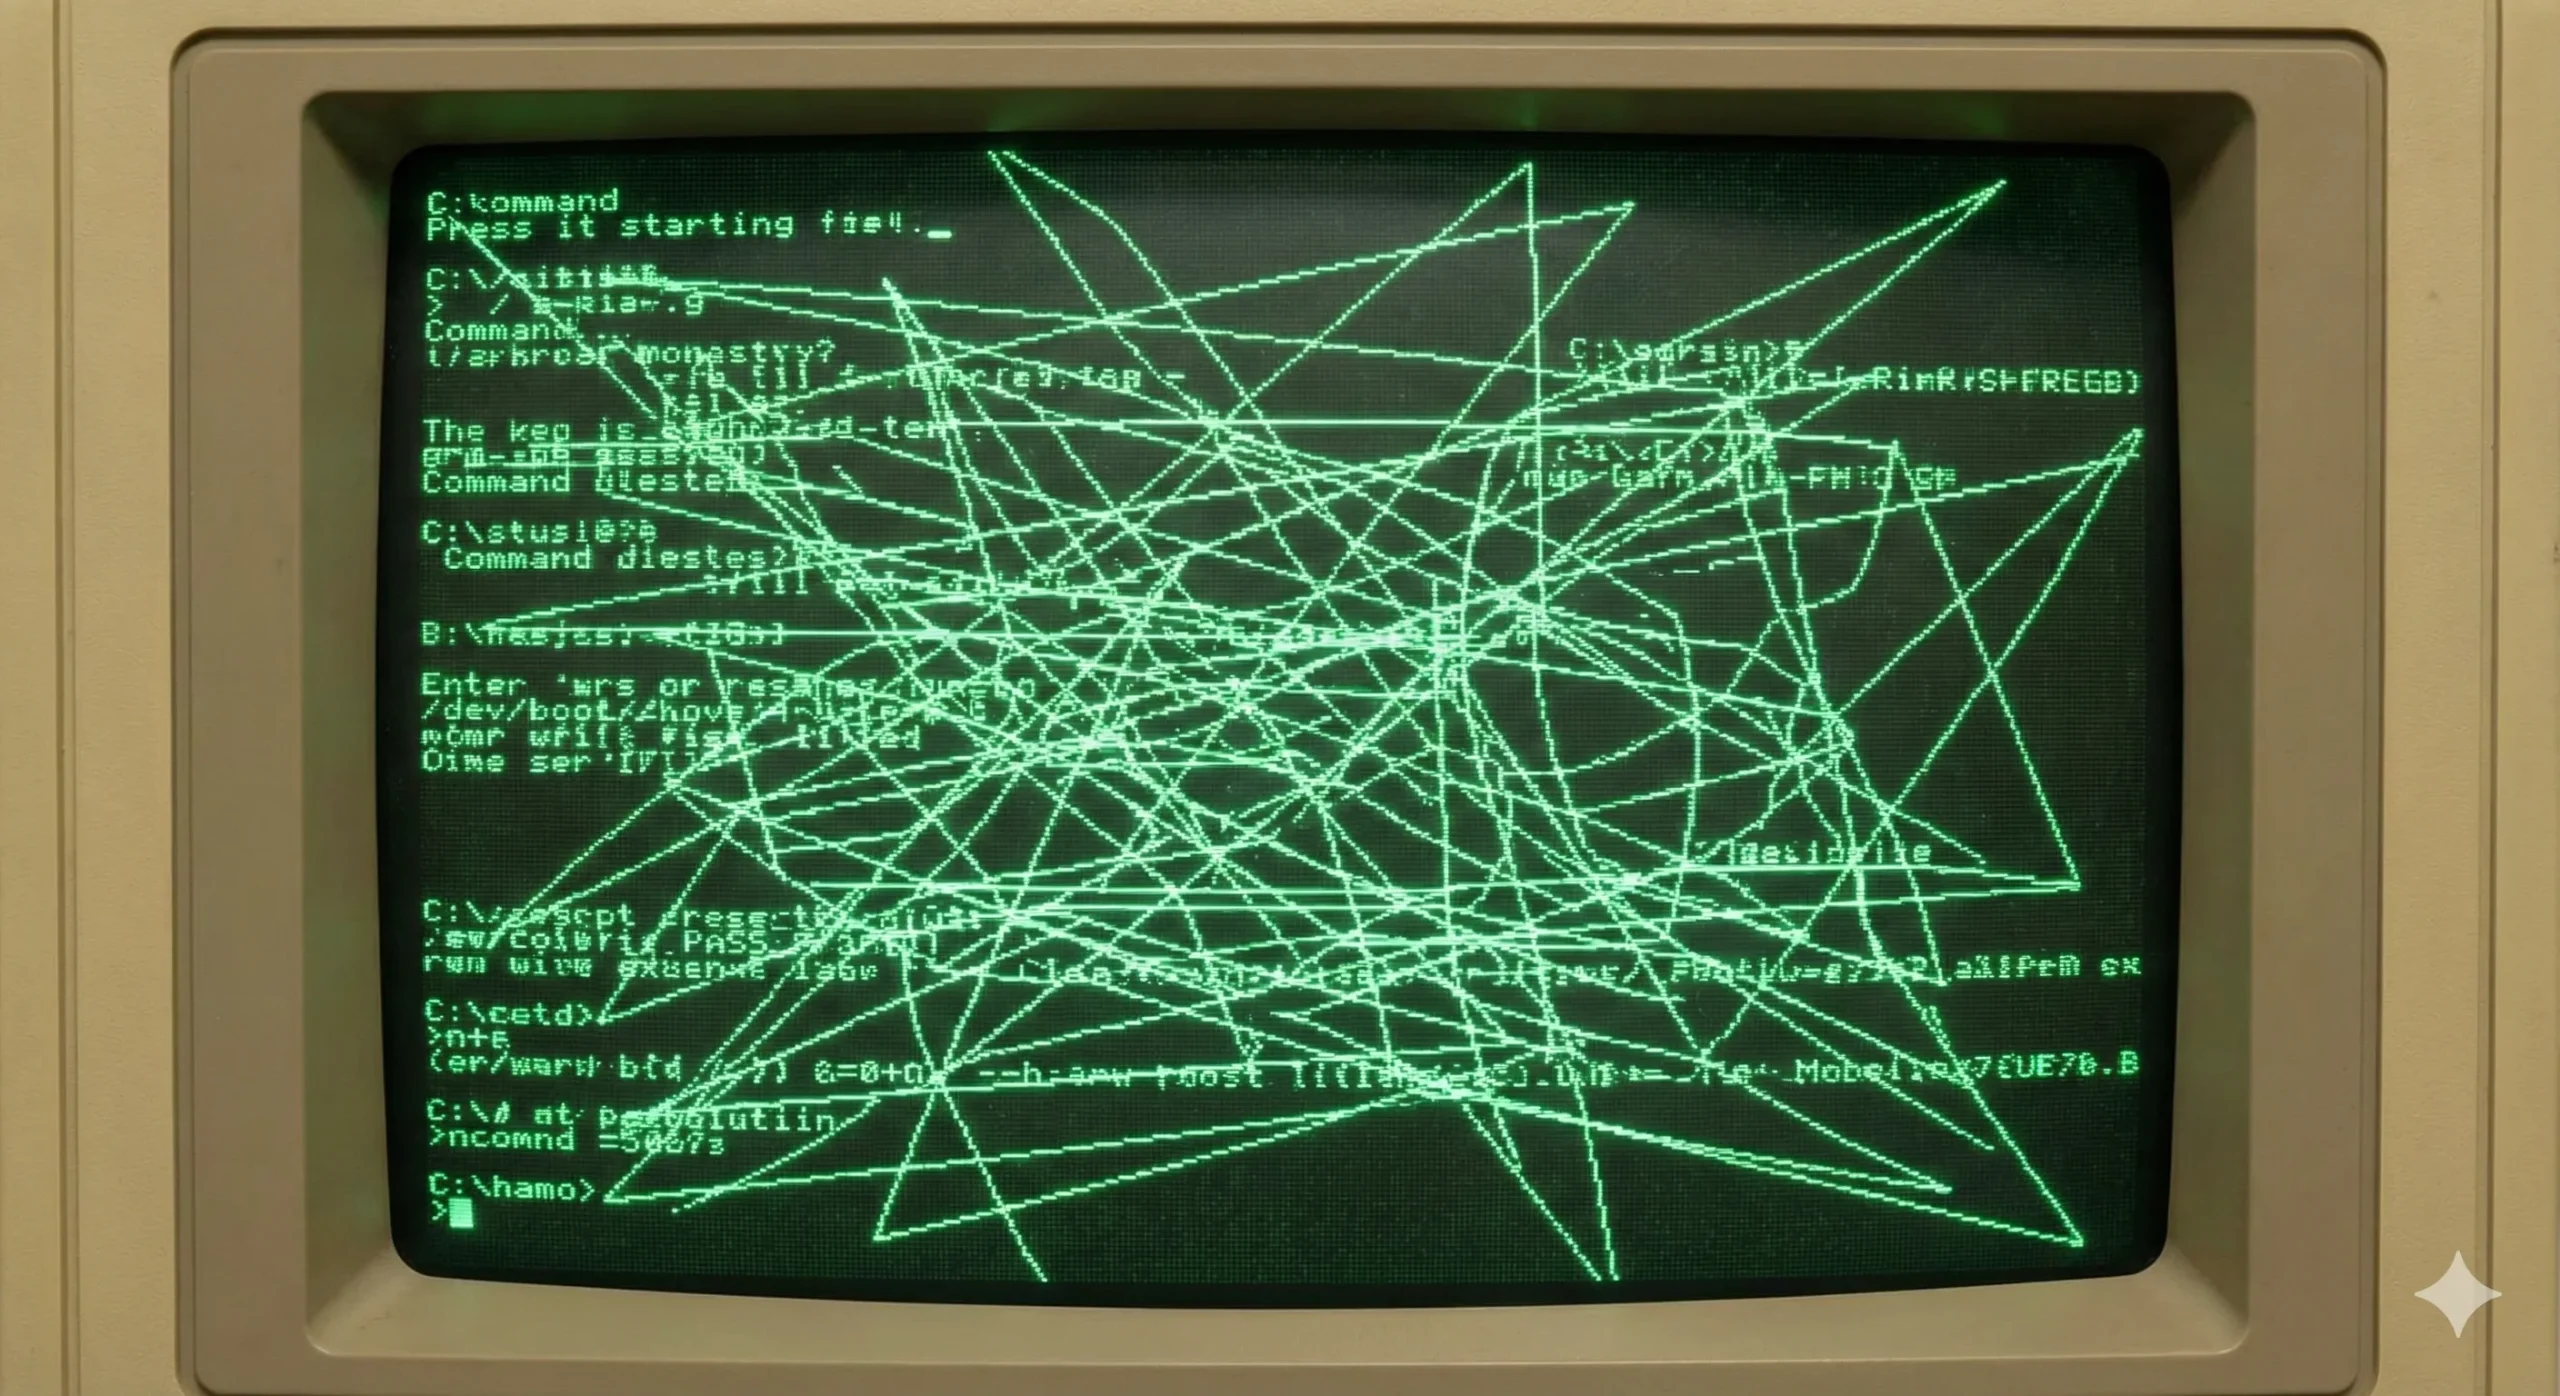
While Sysprogs are masters of 32-line ISPF panels and function keys, asking a Cloud Architect to navigate them is a recipe for frustration. This interface barrier is what solidifies the silo. The goal is not to force distributed teams to learn ISPF, but to translate that data into a visual language they already understand.
Note: The "Language Barrier"
It’s not just about tools; it’s about language. Distributed SREs speak in “Latency” and “Error Rates.” Mainframe Sysprogs speak in “Channel Status” and “Transmission Queues.”
A unified monitoring strategy doesn’t just move data; it translates it. It turns a cryptic “XMITQ Full” error on z/OS into a clear “High Latency” alert on the SRE dashboard.
Key Metrics: What to Watch in z/OS Middleware
Which metrics are critical varies from company to company, but when integrating middleware KPIs from z/OS into your broader dashboard, you don’t need every SMF record. You need the “Golden Signals” of middleware health that actually impact the business.
For example, when running IBM MQ on z/OS, these are a few of the indicators that matter:
1. Transmission Queue (XMITQ) Status
This is often the smoking gun in hybrid setups. The Transmission Queue is the bridge between your mainframe and the distributed world.
- The Scenario: Your cloud app is sending messages, but getting no response.
- The Cause: The XMITQ on the mainframe is backing up because the channel to the cloud is down.
- The Fix: Monitoring this depth gives you instant visibility into “border” issues.
2. Queue Depth & Trends
A high queue depth isn’t always bad. It might just be a batch job running. The real metric to watch is the rate of change.
- Question: Is the queue filling up faster than the consumers can drain it?
- Action: Alert on the trend, not just the static number.
3. Channel Status
Is the channel RUNNING, PAUSED, or RETRYING?
A “Retrying” channel is the silent killer of SLAs. It means the pipe is broken, but the server is still technically “up.”
The Great Debate: Agent-Based vs. Agentless Infrastructure Monitoring
Why hasn’t this been solved yet? Usually, it comes down to the friction of Agents.
The “Agent” Approach (The Old Way)
Most modern monitoring tools require you to install proprietary software agents on the endpoints you want to monitor. On a Mainframe, this is problematic:
- High Costs: Agents consume MIPS (mainframe processing power), which drives up your monthly bill.
- Stability Risks: Sysprogs are hesitant to install 3rd-party code that could crash a critical LPAR.
- Change Control: Getting approval to install an agent can take months.
The Agentless Approach (The Infrared360 Way)
You do not need to install invasive agents on your z/OS LPARs to get visibility.
Infrared360 takes an approach focused on agentless infrastructure monitoring. It connects remotely to your z/OS queue managers and middleware instances via secure channels, gathering real-time metrics without consuming precious MIPS or risking system stability.
Because there is no software to install on the managed systems, you can typically deploy in 15–60 minutes, rather than months.
This allows you to treat the Mainframe as just another node in your topology. You can instantly auto-discover queues and channels alongside your Linux and Cloud messaging servers
How to Integrate Mainframe into Distributed Monitoring
The goal is not to force Mainframe experts to use cloud tools, or vice versa. The goal is a Unified View (a single pane of glass) where all teams can see the status of the environment.
By using an agnostic, agentless layer like Infrared360, you can normalize the data:
- For the SRE: Forward z/OS alerts to 3rd party tools like ServiceNow or Splunk. They get the “Red Light” notification in the tools they already use.
- For the Sysprog (Trusted Spaces™): This is the key to collaboration. As Corbett highlighted, managing granular access via RACF for every single user is complex and time-consuming. Using Trusted Spaces™, you can push those security rules into the GUI. You can give distributed teams “Read-Only” visibility into specific mainframe queues without giving them admin rights on the mainframe itself. They can see the problem, but they can’t break the queue.
- For the Business: Generate SLA reports that prove availability across the entire hybrid stack, not just the cloud portion.
Overcoming “Alert Fatigue” on Legacy Systems
Once you have visibility, the danger becomes “Alert Fatigue.”
Mainframes generate massive amounts of log data. If you pipe all of that into a notification channel, your team will ignore it.
Predictive middleware alerting is the answer.
Instead of alerting when a queue is full (which is often too late to fix the problem without an outage), configure Infrared360 to alert when a queue is deviating from its historical norm.
- Bad Alert: “Queue depth is > 5000.”
- Good Alert: “Queue depth is rising 20% faster than it usually does on a Tuesday morning.”
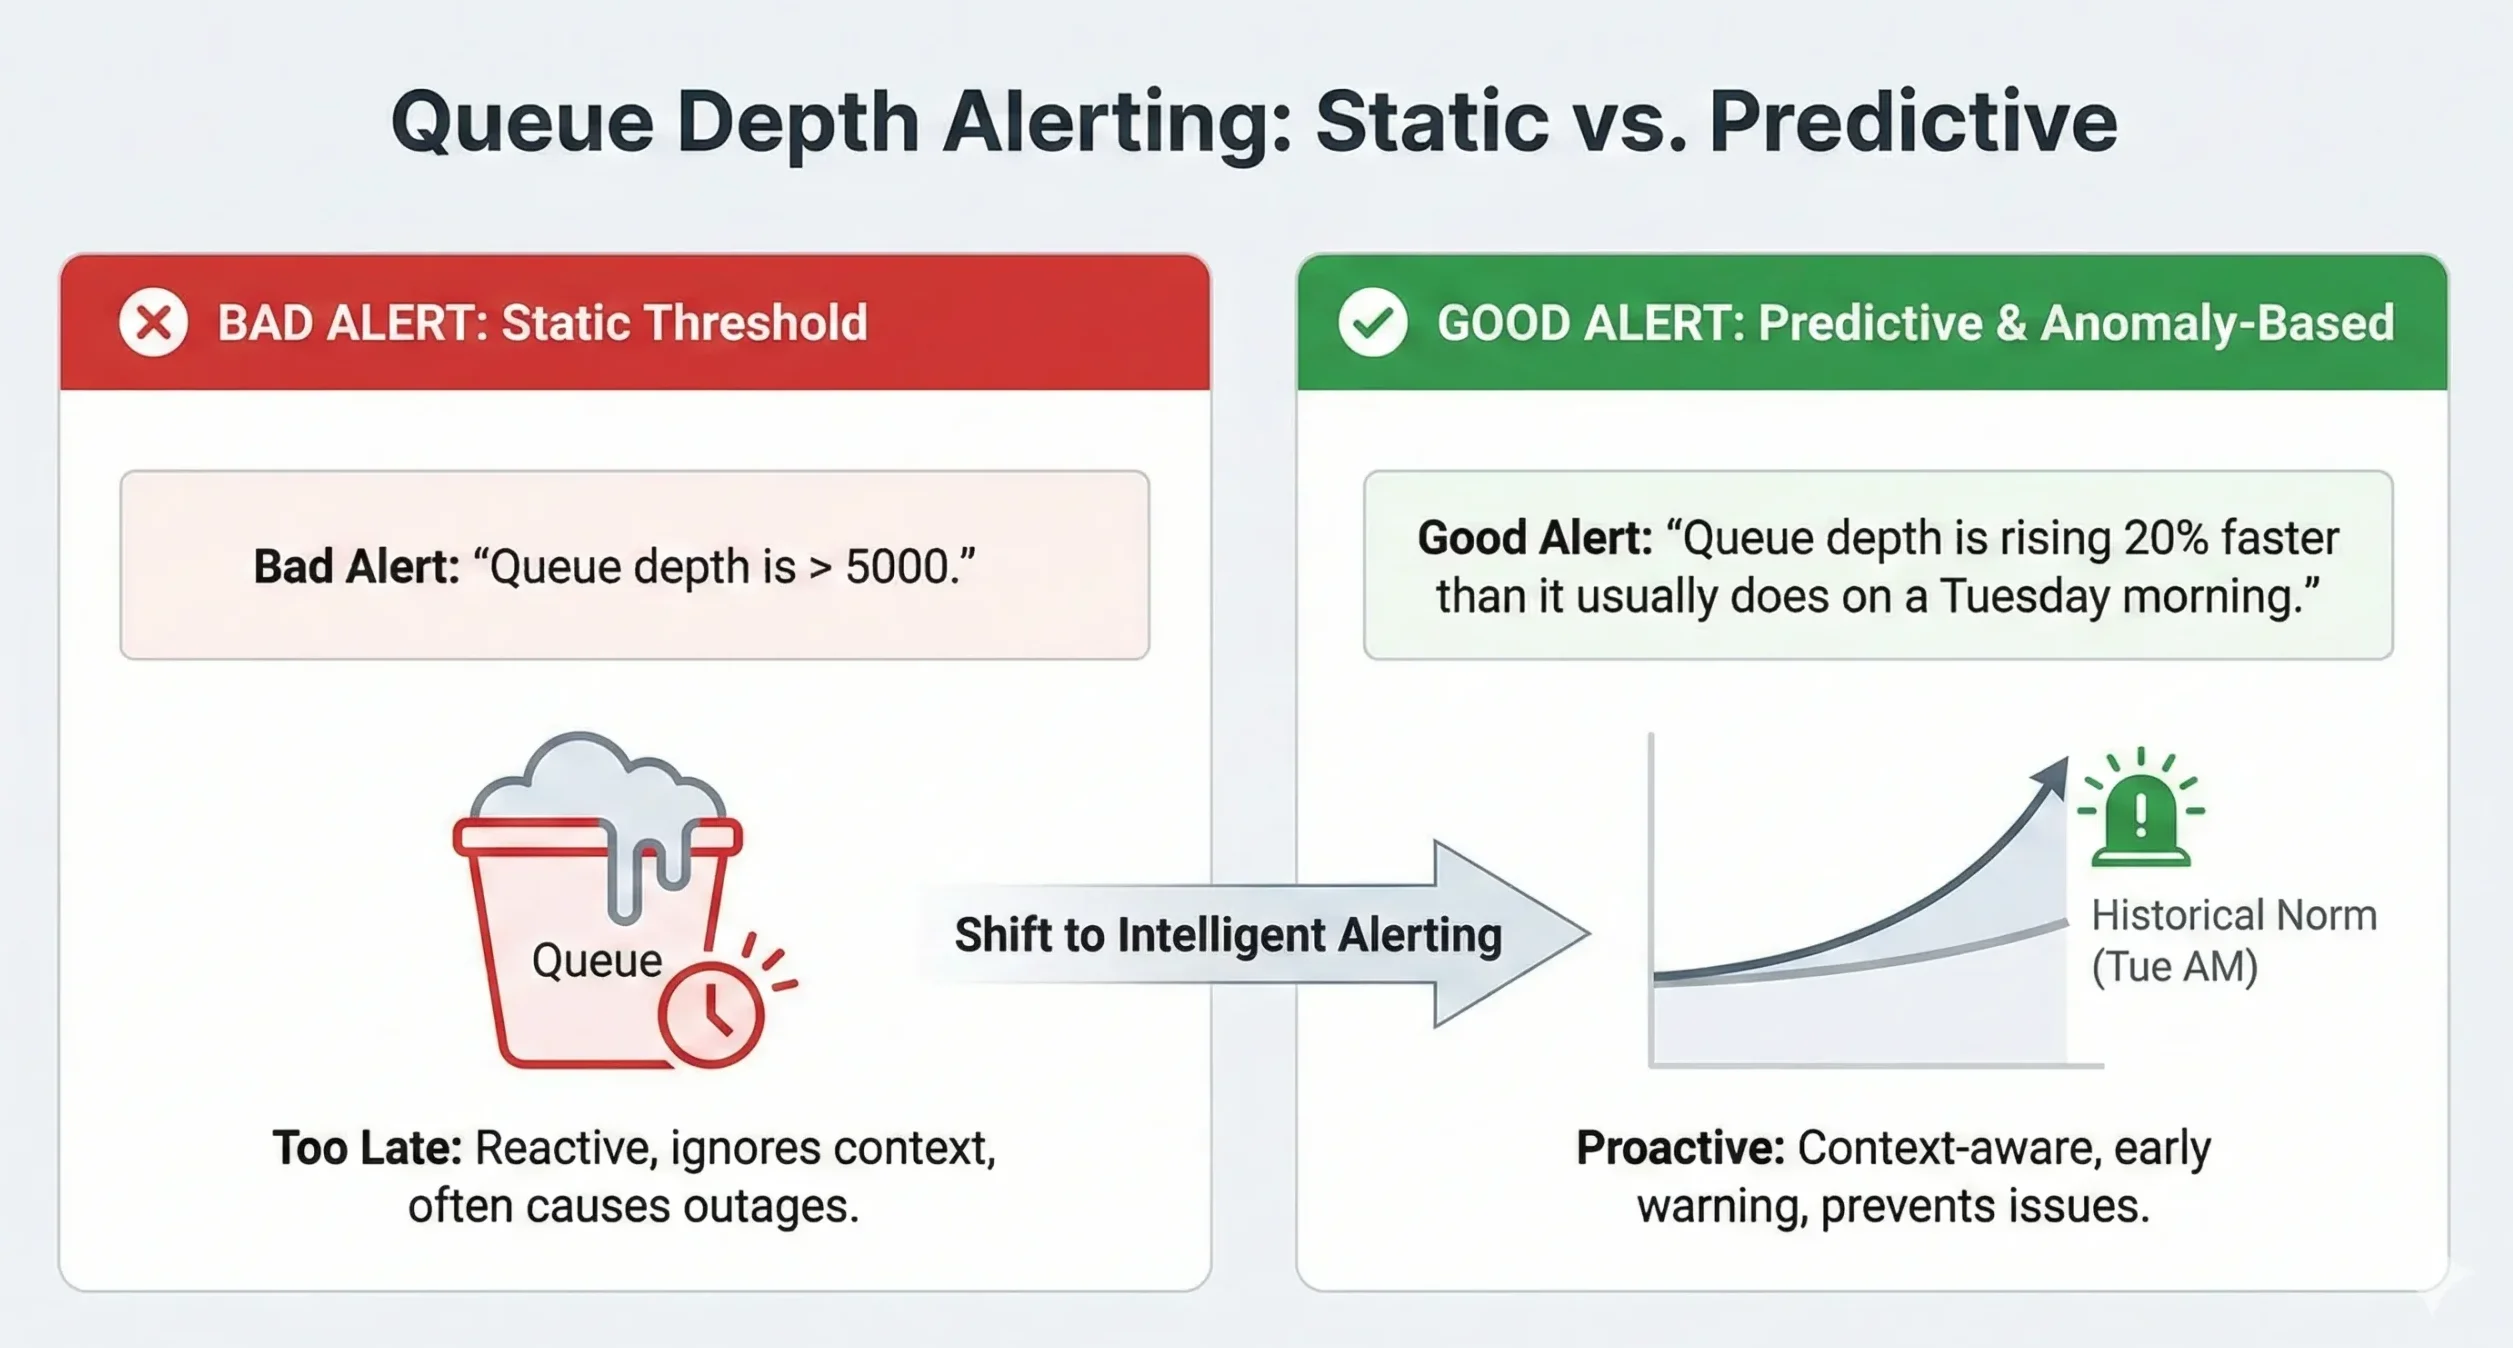
This gives you Situational Awareness. You aren’t just reacting to crashes; you are seeing the storm clouds gather before the rain starts.
Key Takeaways: Breaking Down the Silo
The Mainframe is not going away, but the “Silo” mentality must. As long as your z/OS environment is treated as a separate island of monitoring, your Mean Time To Resolution (MTTR) will suffer.
Here are the key points to remember when building your strategy:
- Focus on Service, Not Just Server: Knowing the LPAR is “Up” is not enough. You must monitor the middleware queues and channels.
- Watch the Golden Signals: Prioritize Transmission Queues (XMITQ) and Channel Status to catch hybrid cloud failures early.
- Go Agentless: Avoid the high cost and risk of mainframe agents. Use remote monitoring to get data without the MIPS penalty.
- Use Trusted Spaces™: Delegate visibility securely. Let distributed teams see their own queues without risking mainframe security.
- Unify the Data: Don’t force teams to switch tools. Feed mainframe alerts into the distributed dashboards (Splunk/ServiceNow) your SREs already use.
Don’t let the mainframe be your blind spot.
