Essential KPIs for Effective ACE Monitoring
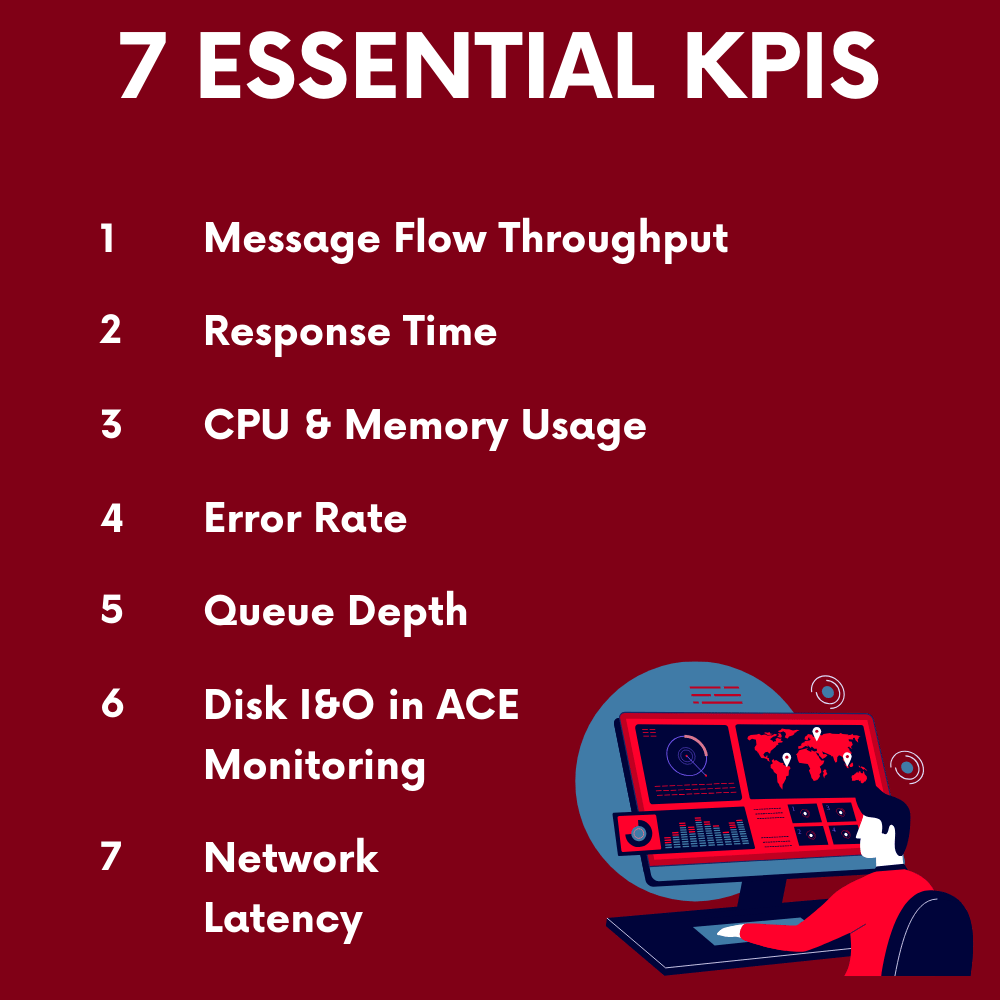
ACE Monitoring, or monitoring of IBM® App Connect Enterprise (ACE), is crucial for ensuring seamless integration processes across diverse environments. As organizations increasingly rely on ACE to connect applications and data both on-premises and in the cloud, the need for robust monitoring grows. Effective ACE Monitoring helps to maintain performance, ensure reliability, and optimize resource use. In this article, we explore the key performance indicators (KPIs) essential for ACE Monitoring, focusing on message flow throughput, response times, CPU and memory usage, error rates, and more.
1. Monitoring Message Flow Throughput
Definition:
Message flow throughput is a vital metric. It measures the number of messages processed by the ACE integration server over a specific period.
Importance:
- Performance Insights: High throughput indicates efficient processing, while a drop could signal performance issues or bottlenecks. Monitoring throughput helps detect these issues early.
- Capacity Planning: Understanding the throughput trends assists in planning for future capacity needs and scaling resources effectively.
- Service Level Agreements (SLAs): Monitoring for throughput ensures compliance with SLAs, which often define minimum throughput requirements.
Monitoring Tip:
- Use ACE Monitoring tools to collect and analyze throughput data.
- Regularly monitor throughput trends to identify peak loads and off-peak performance.
- Set alerts for significant drops in throughput to trigger immediate investigation.
2. Tracking Response Times
Definition:
Response time is a key KPI in ACE, representing the time taken to process a message from receipt to response.
Importance:
- User Satisfaction: Quick response times are essential for applications dependent on ACE for backend processing.
- Operational Efficiency: Monitoring for response times helps ensure that response times remain low, indicating efficient message flows and resource use.
- Early Problem Detection: Consistent monitoring of response times helps detect anomalies, indicating potential performance degradation.
Monitoring Tip:
- Monitor average, minimum, and maximum response times to get a complete picture.
- Use end-to-end monitoring solutions for ACE to capture response times across integration points.
- Correlate response time data with CPU and memory usage to identify potential bottlenecks.
3. Monitoring CPU and Memory Usage
Definition:
CPU and memory usage are critical metrics in ACE monitoring, reflecting the server’s processing power and memory consumption.
Importance:
- Resource Optimization: Regular monitoring of CPU and memory usage ensures that resources are neither overused nor underused, optimizing performance.
- Scalability: monitoring helps determine whether the current setup can handle additional loads or if scaling is necessary.
- Cost Control: Especially in cloud environments, monitoring of resource usage can prevent unnecessary expenses.
Monitoring Tip:
- Set thresholds in your ACE Monitoring tools to alert you of high CPU or memory usage.
- Watch for signs of memory leaks by observing gradual increases in usage without corresponding throughput.
- Use monitoring data to correlate CPU and memory usage with other KPIs like response times and throughput.
4. Error Rates
Definition:
Error rates, a crucial metric in ACE monitoring, indicate the number of errors occurring during message processing, such as parsing errors or connectivity issues.
Importance:
- Reliability: High error rates detected through monitoring could mean misconfigurations or faults within message flows.
- Troubleshooting: monitoring error rates helps quickly pinpoint error sources, reducing downtime.
- Compliance: Many businesses must maintain low error rates, making this a vital aspect of ACE monitoring.
Monitoring Tip:
- Categorize errors for targeted troubleshooting.
- Combine monitoring of error rates with logs for deeper insight.
- Set alert thresholds within your monitoring solution to respond quickly to increased error rates.
- Note: This makes it critical to have an ACE monitoring solution that allows you to set multiple, stacked, alert parameters.
5. Queue Depth
Definition:
Queue depth is another critical metric for ACE, indicating the number of messages waiting in a queue for processing.
Importance:
- Identifying Bottlenecks: Monitoring of queue depth helps detect performance bottlenecks that may cause delays or message loss.
- Resource Management: Regular monitoring helps allocate resources more effectively to handle message volumes.
- System Health: Persistent high queue depth uncovered through monitoring may indicate broader systemic issues.
Monitoring Tip:
- Monitor queue depth trends regularly to identify unusual spikes.
- Use alerts to trigger action when queue depth exceeds acceptable levels.
- Note: it’s important to use a monitoring solution that have secured, permissions-based administration capabilities so that you can effectively automate responses to alerts when appropriate.
- Analyze queue depth data to optimize resource allocation and message flow design.
6. Disk I/O in ACE Monitoring
Definition:
Disk I/O metrics measure the rate of data read and write operations on disk, critical for understanding system performance.
Importance:
- Performance Insights: Monitoring of disk I/O identifies performance issues related to data storage and retrieval, crucial for optimizing storage strategies.
- Troubleshooting: High disk I/O results in your monitoring may indicate problems like inadequate memory or excessive logging.
- Infrastructure Planning: Monitoring disk I/O helps determine whether current storage solutions meet performance needs.
Monitoring Tip:
- Monitor read and write operations separately to understand their impacts.
- Use monitoring tools to correlate disk I/O metrics with CPU and memory usage.
- Ensure adequate storage provisioning for anticipated I/O loads.
7. Network Latency and ACE Monitoring
Definition:
Network latency, when tracked as part of you monitoring, measures the time data takes to travel between the integration server and external systems.
Importance:
- User Experience: High network latency affects applications reliant on ACE for backend processes.
- Integration Efficiency: Monitoring of network latency is crucial in hybrid and multi-cloud setups to ensure smooth data flow.
- Cost Management: Effective monitoring of network latency can reduce unnecessary data transfer costs.
Monitoring Tip:
- Measure both internal and external latency in to locate delays.
- Use tools that provide detailed latency analysis, including packet loss and jitter.
- Correlate network latency with other ACE metrics to identify its impact on overall performance.
Conclusion
Effective ACE Monitoring is vital for maintaining the performance, reliability, and scalability of IBM App Connect Enterprise environments. By tracking essential KPIs such as message flow throughput, response times, CPU and memory usage, error rates, queue depth, disk I/O, and network latency, organizations can proactively address potential issues and optimize their integration processes. A robust ACE Monitoring strategy ensures that the integration environment remains efficient, reliable, and cost-effective, ultimately driving better business outcomes.
With the right tools and best practices, ACE Monitoring becomes a powerful ally in ensuring your integration landscape remains healthy and resilient in an ever-evolving digital ecosystem.
More Infrared360® Resources


