Retrieving IBM® MQ Queue Status and Statistics: A Simplified Approach
To retrieve the status and statistics of an IBM MQ Queue using command line tools, you’ll primarily use the runmqsc command line tool. This utility allows you to interact with a queue manager and gather various types of data about the queues it manages.
Below are the detailed steps required to check the status and statistics of an MQ Queue, but if you want a faster way of retrieving the status and statistics of a single queue or even thousands, see the second half of the article at the bottom:

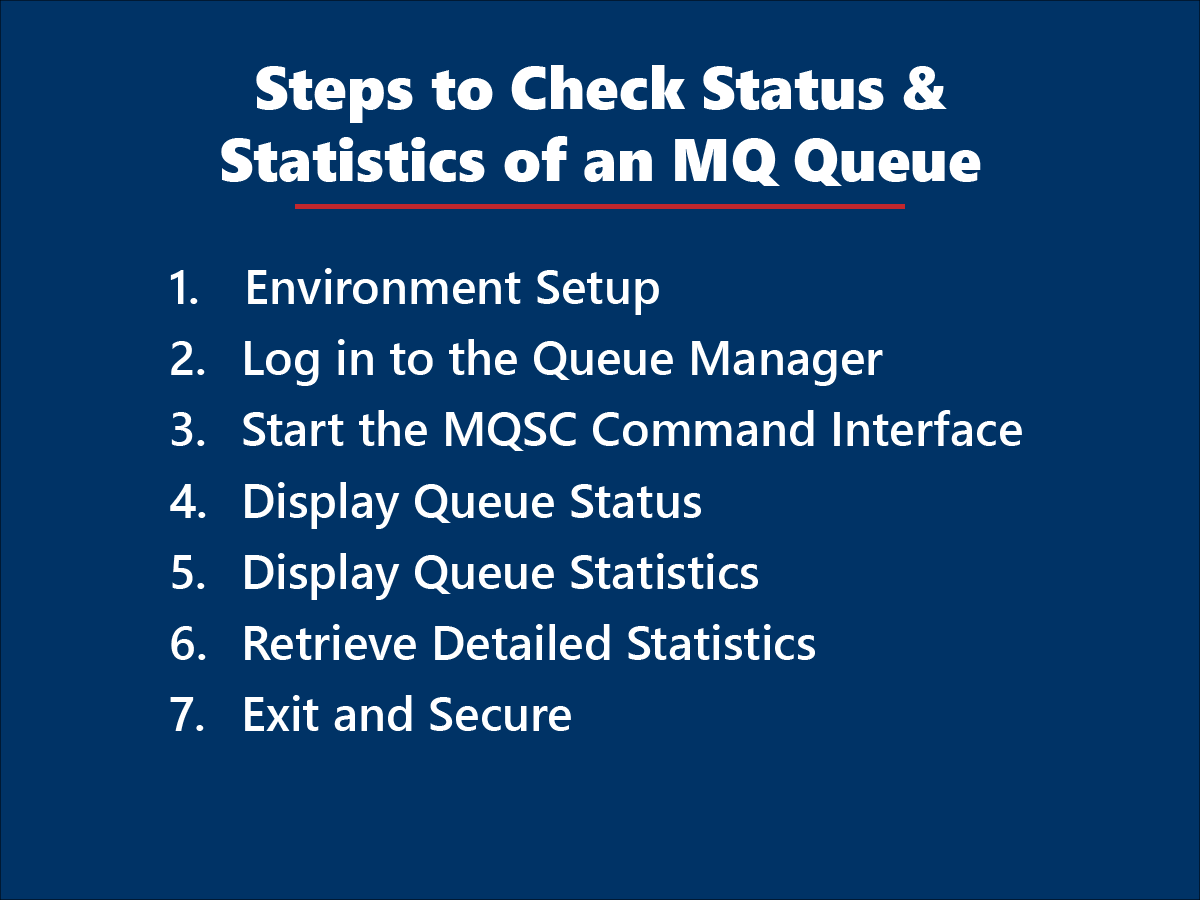
Step 1: Environment Setup
Access the MQ command line tools, typically located in the bin folder of your IBM MQ installation directory.
Step 2: Log in to the Queue Manager
Before executing any commands, you need to connect to the MQ queue manager that hosts the queue you’re interested in.
Open your command line tool and set the environment variables if needed:
# Set MQ environment variables (this step may vary based on your operating system and installation)

cd /path/to/mq/bin
. setmqenv -s
Step 3: Start the MQSC Command Interface
To interact with the queue manager, you’ll use the MQSC command-line tool runmqsc. This tool allows you to enter commands interactively or pass commands via a script.
To start the MQSC interface for a specific queue manager named QM1, enter:
runmqsc QM1Step 4: Display Queue Status
Once connected to runmqsc, you can execute commands to retrieve the queue’s status.
For example, to get the status of a queue named MYQUEUE, you would use:
DISPLAY QSTATUS('MYQUEUE') ALLThis command displays all status information for MYQUEUE, including the queue type, open input count, open output count, and other relevant details.
Step 5: Display Queue Statistics
You should enable statistics on the queue manager and the queue itself to get statistics about the queue. You can check statistics using:
DISPLAY QMGR STATQIf statistics are disabled, you can enable them with:
ALTER QMGR STATQ(ON)Retrieve Statistics: To view collected statistics, a custom program needs to be written to subscribe and read data from SYSTEM.ADMIN.STATISTICS.QUEUE. This process involves setting up a subscription to the queue where statistics messages are put.
Step 6: Exit runmqsc
After retrieving the required information, exit the runmqsc session by typing:
ENDStep 7: Additional Considerations
Consider piping the above output > to a file, the syntax of which depends on your OS.
Security: Ensure you have the necessary permissions to access the queue manager and perform these operations.
Scripting: For automation, these commands can be scripted and executed as part of a batch job or script.
Monitoring Tools: Consider using IBM’s monitoring tools or third-party solutions for more comprehensive monitoring and alerting.
Following these steps, you can retrieve the status and statistics of queues in IBM MQ using the command line.
While this approach may be useful, a less cumbersome way lets you do it in 3 simple steps!
The Simpler Way
To retrieve and manage the status and statistics of queues in IBM MQ using Infrared360® by Avada Software, follow these three simple steps:
- Select Your Data Source: From the STATS drop-down menu on each Queue Manager (Qmgr), choose the Qmgrs, Queues, Channels, etc., from which you wish to retrieve statistical data.
- Display or Schedule Reports: You can decide whether to display the statistics immediately in a chart or report format or schedule the report to be saved to a specified folder on any path.
- Export Statistics (Optional): If needed, you can export the captured statistics to another system management solution for further analysis or integration.
Additionally, Infrared360’s trusted spaces model ensures that only authorized team members have access to view the charts or reports, enhancing security and data privacy within your team.
Sign up for our monthly newsletter to receive more tips and tricks on IBM MQ and other enterprise middleware, delivered straight to your inbox
More Infrared360® Resources


