- Navigating MQ: From Basics to Best Practices – Managing the IBM MQ Dead Letter Queue
- Simplifying IBM MQ Queue Status and Statistics Retrieval
- Understanding MQ vs. Kafka: Key Differences, Similarities, and Integration Benefits
- Middleware Observability vs. General IT Observability: Key Differences Explained
- Designing a Resilient Middleware Architecture: Best Practices for Modern Enterprises
- Essential KPIs for Effective ACE Monitoring
- Stay Informed in 2025
Best of 2024: Insights and Innovations in Middleware and Messaging
As we look back on the Best of 2024, it’s evident that this year brought forward critical strategies and solutions for navigating the challenges of middleware management, messaging technologies, and enterprise integration. From optimizing MQ operations to building resilient middleware architectures, these articles highlight the insights and innovations that helped businesses enhance performance, ensure reliability, and achieve their goals in a rapidly evolving IT environment.

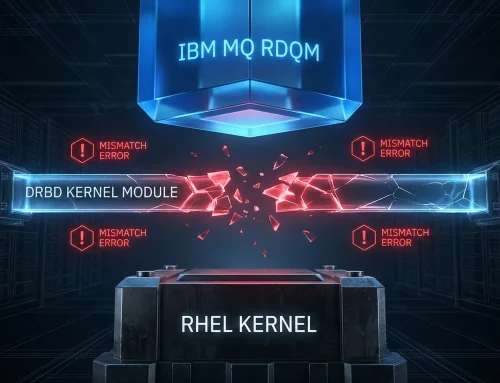
Navigating MQ: From Basics to Best Practices – Managing the IBM MQ Dead Letter Queue
Managing the IBM MQ Dead Letter Queue (DLQ) is crucial for maintaining system reliability and efficiency. The DLQ captures undeliverable messages, serving as a key tool for troubleshooting. This article outlines best practices, including monitoring DLQ contents, implementing error-handling mechanisms, automating message analysis, and regularly reviewing and clearing messages to address root causes.
Ready to streamline your MQ operations? Click here to read the complete guide.
Simplifying IBM MQ Queue Status and Statistics Retrieval
Retrieving status and statistics from IBM MQ queues can be time-consuming with traditional command-line tools like runmqsc. This article outlines the steps, from environment setup to running commands like DISPLAY QSTATUS and ALTER QMGR STATQ, providing insights into best practices for queue monitoring. For a more efficient approach, Infrared360® simplifies the process into three easy steps, offering instant reports, scheduling options, and secure, role-based access for your team.
Discover a better way to manage your MQ queues—read the full guide here.
Understanding MQ vs. Kafka: Key Differences, Similarities, and Integration Benefits
MQ and Kafka are powerful messaging technologies with distinct architectures, features, and use cases. MQ excels in guaranteed message delivery and transactional integrity, making it ideal for financial transactions and inventory management. Kafka, known for its high throughput and scalability, is perfect for real-time analytics and stream processing. While they serve different purposes, integrating MQ and Kafka can create robust systems combining reliability with real-time capabilities.
Learn how to manage both technologies effectively. Read the full article to explore these insights.
Middleware Observability vs. General IT Observability: Key Differences Explained
Middleware observability focuses on the intricate layer that connects applications, including message queues, application servers, and integration frameworks. Unlike general IT observability tools, which monitor metrics like uptime and error rates, middleware observability tracks detailed data such as message flows, bottlenecks, and event correlations. It also integrates with broader IT observability practices for a holistic approach to monitoring.
Discover how tailored middleware management solutions can combine observability with administration to maximize performance and cost-efficiency. Read the full guide to learn more.
Designing a Resilient Middleware Architecture: Best Practices for Modern Enterprises
A resilient middleware architecture is the backbone of scalable, fault-tolerant IT environments. This article explores key principles for designing robust middleware systems, including redundancy, asynchronous communication, circuit breaker patterns, observability, and disaster recovery planning. Implementing these strategies ensures continuous availability, optimal performance under load, and enhanced security.
Learn how advanced monitoring solutions can streamline middleware management and build a resilient foundation for your business. Read the full article to discover actionable insights.
Essential KPIs for Effective ACE Monitoring
Monitoring IBM App Connect Enterprise (ACE) is key to maintaining seamless integration processes and ensuring system performance. This article highlights the seven essential KPIs for effective ACE monitoring, including message flow throughput, response times, CPU and memory usage, error rates, queue depth, disk I/O, and network latency. By tracking these metrics, organizations can proactively address issues, optimize resource usage, and ensure reliability across their integration environments.
Want to improve your ACE monitoring strategy? Read the full guide to learn how.
Stay Informed in 2025
Want to receive articles like these straight to your inbox? Sign up for our newsletter to stay updated with the latest tips, best practices, and expert insights to keep your systems running smoothly and efficiently. Don’t miss out—subscribe today!
More Infrared360® Resources

