

- Key Concepts and the Three Pillars of Observability
- Observability vs. Monitoring: The Aircraft Maintenance Analogy
- Key Benefits of Observability
- Implementing Observability in Practice
- Observability in the Real World and the Future
- The Role of AI/Machine Learning
- The Observability Journey: Where to Go Next
What is Observability and Why Does it Matter for Your Systems?
Have you ever spent hours struggling to pinpoint the root cause of a mysterious system outage? Does it frustrate you when applications suddenly slow to a crawl without a clear reason? These frustrating scenarios are all too common.
That’s where observability proves invaluable. It enables you to rapidly diagnose problems at their source and proactively optimize performance, enhancing system stability and reliability.
In this guide, we’ll discuss:
- The core concepts and tools (logs, metrics, and traces)
- How observability differs from traditional monitoring
- The real-world benefits of implementing a strong observability strategy
- Useful measures and strategies to begin
- The future of observability, including the role of AI and Machine Learning
Let’s dive in and unlock the power of understanding your systems!
Key Concepts and the Three Pillars of Observability
Observability gives you the ability to understand what’s happening inside your complex systems, even when things go wrong. It originated from control theory, a field of engineering focused on maintaining system stability. The three pillars are:

Logs
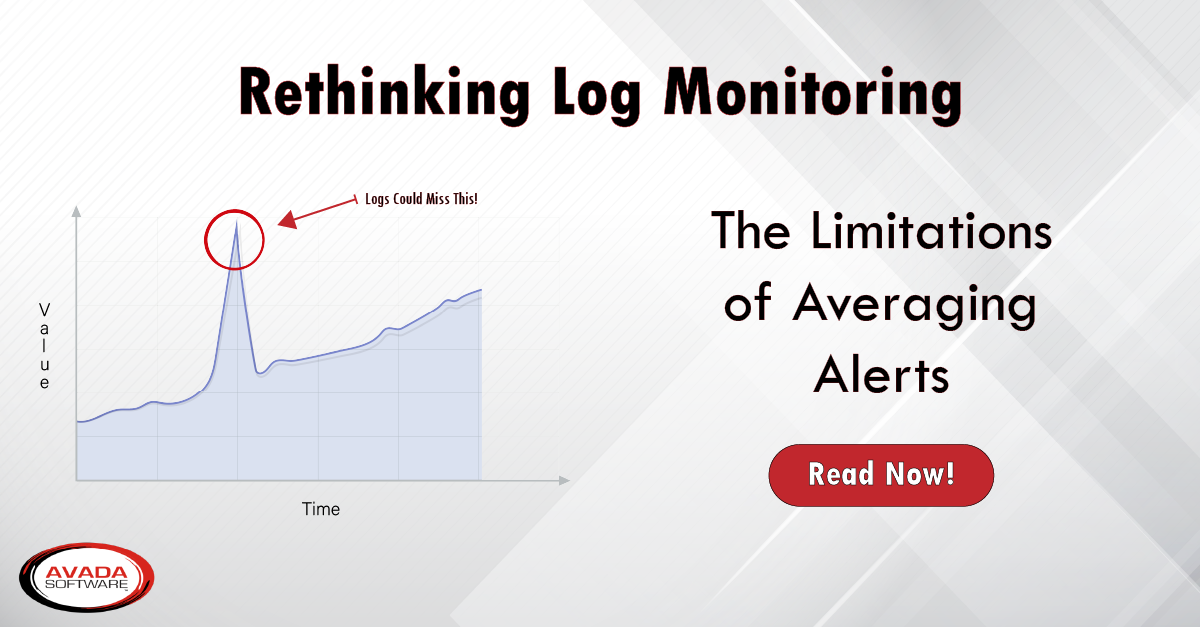
Logs are files containing text records of events within a system. They offer a valuable historical perspective, allowing you to investigate issues after they’ve occurred. However, traditional log monitoring approaches have their limitations:
- Overwhelming Volume: The sheer amount of log data generated by complex systems can be difficult to parse and analyze effectively.
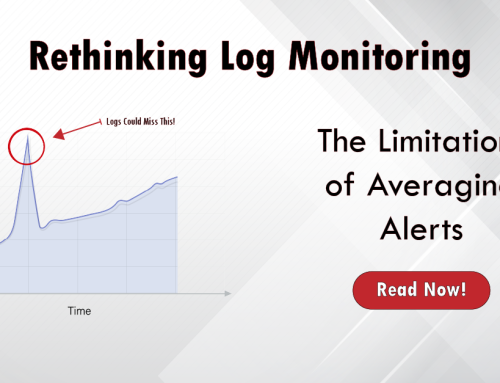
- Averaging can be Misleading: Focusing on averages in log data can obscure important anomalies, delays responses, and mask potential problems.
- Difficulty in Contextualizing: Logs alone often lack the context needed to pinpoint the root cause of issues quickly, especially in distributed systems.
To maximize the value of logs, consider:
- Smart filtering: Reduce noise by focusing on critical events.
- Correlation with other data: Combine logs with metrics and traces for a more complete picture.
- Proactive analysis: Look for patterns or anomalies that might signal trouble ahead of time.
Metrics
Numerical values reflect system health – things like CPU usage, request latency, or error rates. Metrics are essential for monitoring key trends and establishing baselines, providing a starting point for detecting problems. However, relying solely on metrics has limitations:
- They don’t tell the whole story: Metrics might indicate a problem exists but often lack the context needed to pinpoint its root cause or how different components might be interconnected.
- Reactive, not proactive: Focusing solely on metrics can lead to waiting for issues to become severe enough to register a change, hindering proactive problem prevention.
- Middleware Blindspot: Traditional metrics often don’t provide deep enough visibility into middleware health – a critical aspect of modern interconnected systems.
To get the most out of metrics:
- Choose the right ones: Focus on metrics that align with business outcomes and potential middleware bottlenecks.
- Correlate with other data: Combine metrics with logs and traces for a comprehensive, contextual view.
- Set smart thresholds: Establish meaningful alert thresholds to catch issues before they become critical.
Traces
These follow a specific request’s path through distributed systems, providing step-by-step visibility into how different components interact. Traces are invaluable for debugging complex issues and understanding performance bottlenecks in distributed environments. Here’s why a proactive approach is crucial:
- Complexity Untangled: Traces help make sense of how requests flow through modern systems, where a single transaction might touch many services and databases.
- Real-time Problem Solving: Proactive trace collection allows you to analyze an incident as it’s happening, enabling faster troubleshooting and minimizing downtime.
- Beyond Incident Response: Traces can reveal subtle performance issues or unexpected dependencies, empowering you to optimize systems even when there’s no active problem.
Note: If you’re not collecting traces proactively, think of it like closing the barn door after the horse has escaped – you’ll know what happened, but it’s too late to have been able to prevent the issue from occurring.
Observability vs. Monitoring: The Aircraft Maintenance Analogy
Maintaining a complex aircraft requires much more than just waiting for something to break and then scrambling to fix it. Here’s how the concepts of monitoring and observability translate to the world of aviation:
Monitoring: The Cockpit Instruments
- Purpose: Just like pilots use cockpit instruments, developers need real-time system metrics.
- Limitations: While critical, these indicators primarily tell you what is happening right now. They might show a problem, but not always the root cause. For example, a leak or a failing pump could cause low oil pressure, which is important to know, but why did it happen in the first place?
Observability: The Black Box and Telemetry
- Purpose: Aircrafts have “black boxes” (flight data recorders) and sophisticated telemetry systems for this purpose. These capture a vast amount of detailed data about the aircraft’s behavior over time.
- Benefits: Analyzing this data allows engineers to:
- Reconstruct incidents: Understand the chain of events that led to a failure
- Predict potential issues: Identify patterns or anomalies that might indicate a component nearing end-of-life, enabling preventative maintenance.
- Optimize performance: Fine-tune engine settings, flight paths, and other factors for increased efficiency.
In software systems, just like in aircraft, both approaches are crucial:
- Monitoring provides the immediate visibility needed to detect outages or performance degradation as they happen.
- Observability enables engineers to not only fix immediate issues, but also to create stronger systems in the long run.
Key Benefits of Observability
Going beyond simple monitoring empowers you to understand how your systems truly work and act proactively. Here’s how you benefit:
- 1Identify problems quickly by using different data sources. This will help you find the cause of issues faster. As a result, you can come up with solutions more quickly. This means less time without service.
- 2Identify issues in your code or systems early on to prevent major problems. This will help ensure seamless operation for users.
- 3Improve incident response by understanding what went wrong. Understand why the incident occurred. Learn how to prevent similar incidents in the future.
- 4Make it easier for developers to improve their code and fix problems by giving them detailed insights. This will help them troubleshoot issues more efficiently. They can also optimize their code for real-world situations.
Observability helps with troubleshooting and leads to more reliable systems, happier users, and a more efficient development process. Observability is important for identifying and fixing issues. It also contributes to the overall performance and satisfaction of users. Additionally, it streamlines the development process.
Implementing Observability in Practice
To get the most out of observability, you need a clear plan. Here are the key steps involved:
Best Practices:
- Focus on outcomes: Tie observability metrics to critical business KPIs.
- Collaborate across teams: Promote DevOps/SRE culture for shared understanding.
- Iterate and improve: Observability is a journey, not a one-time project.
Observability in the Real World and the Future
Observability isn’t just a theoretical concept – it has tangible business impact across various industries. Here’s a glimpse into its real-world applications and future potential:
Use Cases
The Role of AI/Machine Learning
AI and Machine Learning are rapidly transforming observability, making it even more powerful.
- Anomaly detection using AI/Machine Learning can identify unusual patterns before they are noticeable to humans, helping to prevent problems.
- AI/Machine Learning technology automates root cause identification by quickly pinpointing the main cause of incidents. Analyzing large amounts of data accomplishes this. This saves time in troubleshooting.
- Predictive analytics: Instead of being purely reactive, observability could become predictive – warning you of potential problems before they even occur
The Observability Journey: Where to Go Next
By now, you should have a solid understanding of observability’s power and potential benefits. But implementing an effective observability strategy is a journey, not a sprint. Here’s where to focus next:
- Assess your current state: Where are your monitoring pain points? What kind of issues take the longest to resolve?
- Define goals: What business outcomes do you want observability to drive (faster incident response, improved uptime, etc.)?
- Explore tools and solutions: Research observability platforms – including those tailored to your tech stack (e.g., middleware-specific tools).
- Start small and iterate: Don’t try to do everything at once. Begin with a pilot project and expand from there.
Need help navigating your observability options?
Infrared360 specializes in making complex middleware environments observable. If you’re struggling with blind spots in your messaging infrastructure, let’s talk.
Related Posts


More Infrared360® Resources


