

The term APM was coined for application performance monitoring. It defines a criteria for which applications can be monitored for efficiency.
The first set of performance metrics defines performance as experienced by end users of the application. An example would be average response times under peak load.
The second set of performance metrics measures the computational resources used by the application, indicating whether there is adequate capacity to support the load, as well as possible areas of a performance bottleneck.
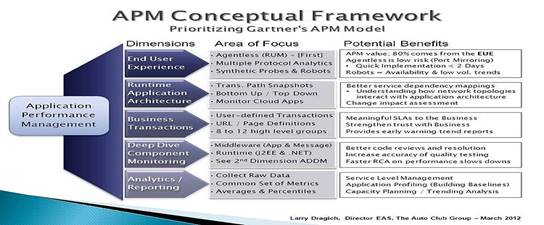
In their APM Conceptual Framework, Gartner Research describes five dimensions of APM:
- End user experience monitoring – (active and passive)
- Application runtime architecture discovery and modeling
- User-defined transaction profiling (also called business transaction management)
- Application component monitoring
- Reporting & Application data analytics
In 2016, Gartner updated its definition, into three main functional dimensions. [footnote]
- End-user experience monitoring (EUEM) has evolved to Digital experience monitoring (DEM);
- Application discovery, now combines 3 formerly separate dimensions (application architecture, user-defined transactions, and component deep-dive), since all three are interlinked and focused on problem remediation
- Application analytics (AA).
Finding solutions that encompassed the 5 layers was difficult enough, but now three layers have been collapsed into 1. This one dimension alone has many suitors, and further distances itself from the other 2 layers. I believe that it’s more accurate, but that makes finding “a” solution more difficult.
Even before the reorganization of dimensions, most IT people categorized APM into a User Response dimension; tools measuring the perspective of the User Experience. Given computational resources cannot be invoked without the user’s request getting to the application resource, network tools are part and parcel of a user experience. So why would it not be encompassed within user experience? Well, because it has its own category (NPM) based solely upon network traffic. Therefore a user experience is reliant on the behavior of the local device (i.e. Browser or app), the network which carries the request and response, and the application resource environment which processes the request and delivers the response.
Looking at the solutions that are used to provide APM, they are broken down into 3 relative categories.
- Application Metrics– Uses various server and application metrics. At best they can tell you how many requests your app gets and potentially which requests may be slow. There are limited since they don’t provide component level profiling.
- Code level– This category contains the AppDynamics, and Dynatrace type products that typically focus on code profiling and transaction tracing.
- Network – the ability to measure performance based on network traffic.
Trying to correlate these categories to the three Gartner dimensions seems like it should be an easy match, but that’s far from the case. There are many crossover products, but none complete the stack.
Typically corporations have products that send URLs, time the response, and provide reports based upon using that data. That’s one dimension. Push that information into an analytical tool and it provides part of the story. Then there’s network traffic. Is the user experience changed because of network load at the time of the User experience or does the user experience put load on the network traffic? Again this is another part of the story. The two pieces of information would need to be cross-mapped to find out a truer picture.
However, none of the above would tell you what was going on with the application resources during the time of the user experience. Because an application resources is not “a” resource. When it was just a terminal to a mainframe, the stat could easily divide the network traffic and the size of the request/response from the application resource, providing the dividing line between load and the application itself. In today’s world, an application traverses many resources and other networks. Therefore trying to correlate this huge amount of data is not an easy task. This is especially true of asynchronous transactions which span many environments.
The application itself can be measured at the component resource level. But the components may be many and finger printing “a” transaction is not an easy feat. Now it’s the user experience, the network, the application server load, the application resource within that server, tangent requests to other tiers like databases, security authentication mechanisms, custom applications, and external data feeds via micro services and then back along those same pathways. Not to mention spawned pathways that might then be triggered to forward the results of actual occurrence of that transaction so that other systems can be updated. In this case think of supply chains (whether physical or digital). A transaction is requested, gets a reply, the user experience has occurred. But that transaction now spawns a new life to update financial records, suppliers, inventory, clearing, accounting, auditing, and perhaps external compliance organizations. Phew! Which part of that matters … user experience, network experience, (an) application experience or some combination?
In these complex application environments it is quite a challenge to deploy resources that capture information along those pathways, collect information from those pathways, then merge and correlate all that data into a usable profile of that user’s transaction. It’s not as easy as, for example, a GPS profiling an automobile’s path and behavior. The automobile doesn’t perform mitosis like a transaction. So the exercise becomes more like tracking a biological trait through a huge population.
All the collection and mapping can be accomplished via an architectural commitment to every piece of the pathway reporting and tracking the SAME exact item throughout the pathway. I will use the word token as a way of explaining the digital image of “a” transaction so that a system can be sure that it’s the same user transaction, no matter how many times it hops from network to network, application component to application component, and no matter how many times it is mutated (transformed) in order to be passed to the different systems (application components, micro bus, database, security interfaces, etc.). This is especially difficult when measuring proprietary applications that are built without standardized APIs.
It is not financially or resource-wise prudent for vendors to interface to proprietary applications. So no company would do so. It is prudent, however, to have that application report its behavior to a tracking mechanism through a standard API.
Having said all that, doing all of the aforementioned is quite expensive from a person resource, time, product, license aspect, never mind costs for repository and calculations resources. Even if you could accomplish this, the result might not give you what you really want, which is to know WHY? Why is that user experience a problem for application A, not B, on system X not system Z, etc.?
What is AEM?
This is what brings me to introduce Application Environment Monitoring (AEM). Most companies are trying to limit resources and time (costs) when trying to find the answers to the above issues. Much of that decision comes down to VALUE. How much can I get to give me a large percent of that knowledge without all the costs and complexity and time? Most people make that decision every day: should I get the 3 extra toppings on a pizza? Not if that pizza costs twice as much. So people tend to give up some features depending upon cost. But they won’t give up having the pizza!
I contend AEM is a much better valued approach to this problem. Outside of the correlational requirements above (which is not to be diminished as irrelevant, but a corporation can purchase a focused user experience solution and a network traffic solution for good value), AEM would simply tell you how the environment is behaving.
Anyone can clearly assume that the user experience will be bad if the device (say along the routing path) is not working. This means the transaction will not get past that device. All the user experience and back-end application component software in the world couldn’t tell me more. If a transaction makes it to a transformational device or application and that device or application is failing, then I certainly know that no matter how many measurements I take, that transaction and the user experience that created it are not going to be very good.
What about the aforementioned pathways; those that have nothing to do with the user experience? The user received their reply. The subsequent spawns did not occur. And therefore the supply chain for that transaction the user initiated was not complete. The user doesn’t care, they got their answer, now it’s on your business to process the chain.
Simply put, knowing that a device, or application, or resource is unavailable, less available, or has a problematic metric, out of the likely hundreds of metrics it tracks, is quick unbiased feedback from which good assumptions can be made. For example, suppose you planned a train ride from DC to Boston. That train’s path goes through Philadelphia. A report shows the power is out in 30th Street Station. Okay, now I can make alternate plans. I can track the status of the return of service. Will the service be restored before the train would even reach Philadelphia? If so, then let’s get onboard. If not, then let’s make alternate arrangements. Is there a cost to the alternate arrangements? Probably. Will that cost be more than the consequence of not completing your trip on time? Decision time, but based upon real time actionable information.
As for WHY? Well, as long as I capture data at each point along the path, I can look at this data for trends and determine the WHY. It’s called post mortem and that valuable information should be analyzed and acted upon to help me to avert similar failures in the future. But right now, I don’t really want to know WHY the power is out in Philadelphia, I just want to get to Boston!
For my money, give me a user experience solution, a network traffic solution, and a component solution that provides me an AWARENESS of the Application Environment. If the AEM can also capture data and merge it with the other two dimensions, then push it into an analytics solution in order to provide me a trend for expectations and correlations, then that would help me to avoid failures and plan for longer term success. That is of great value.


