On this page
- Why MQ Monitoring Requires Extra Attention in Financial Services
- 1. Know What Normal Looks Like
- 2. Monitor Message Age Along With Queue Depth
- 3. Monitor Message Flow Within MQ
- 4. Keep Dead-Letter Queues in View
- 5. Watch Certificates Before Expiration Becomes an Incident
- 6. Give Teams the MQ Visibility They Actually Need
- 7. Keep Historical Monitoring Data Available
- How Infrared360 Helps Monitor IBM MQ in Financial Services
- Build MQ Monitoring Around Business Impact
- Frequently Asked Questions
- Endnotes
In banking and financial services, IBM MQ can sit in the middle of processes where a delayed message can mean a delayed payment, card transaction, account update, trade, or risk check.
That makes IBM MQ monitoring for banking about more than checking whether a queue manager is running. Teams need enough context to see when message flow changes, where processing slows down, and which business services could be affected.
Why MQ Monitoring Requires Extra Attention in Financial Services
Financial institutions combine high transaction volumes with 24×7 availability, strict security requirements, and complex application environments.
Large banks may connect mainframe systems, distributed applications, cloud services, payment networks, and external partners through messaging. IBM’s banking reference architecture describes payment processing and core banking as high-volume, mission-critical workloads. Some financial applications also require high-throughput, low-latency performance, including card transactions, payment processing, fraud detection, and securities processing.[1]
That puts additional pressure on monitoring. Teams need to understand the health of MQ components and whether messages continue to move through the queues and channels supporting those business processes.
1. Know What Normal Looks Like
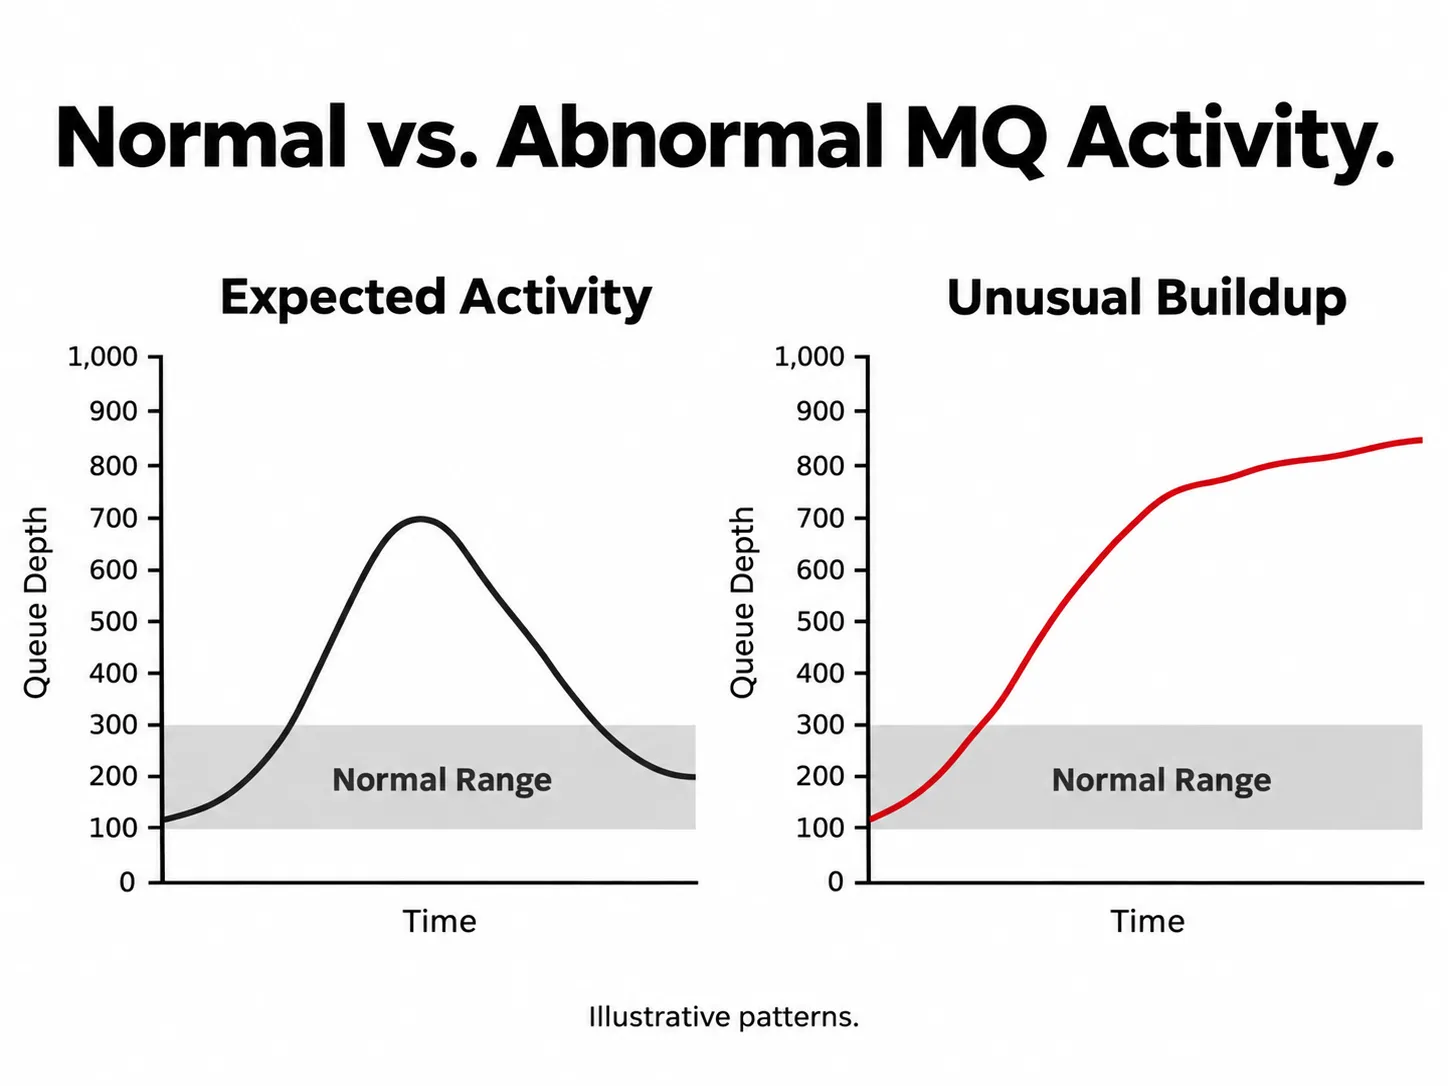
An alert is much more useful when you know what normal activity looks like first. A queue depth of 5,000 messages may be unusual for one application and expected for another.
Establish Baselines for Important MQ Metrics
Build baselines around metrics such as queue depth, put and get rates, message throughput, channel activity, message age, and expected processing patterns.
Financial workloads can also change throughout the day. Business hours, batch processing, settlement windows, market activity, and other scheduled processes may all affect what normal traffic looks like.
IBM identifies understanding the steady state of an MQ environment as one use of real-time monitoring.[2]
The goal is to recognize when activity moves outside its expected range instead of treating every metric the same way at every time of day.
2. Monitor Message Age Along With Queue Depth
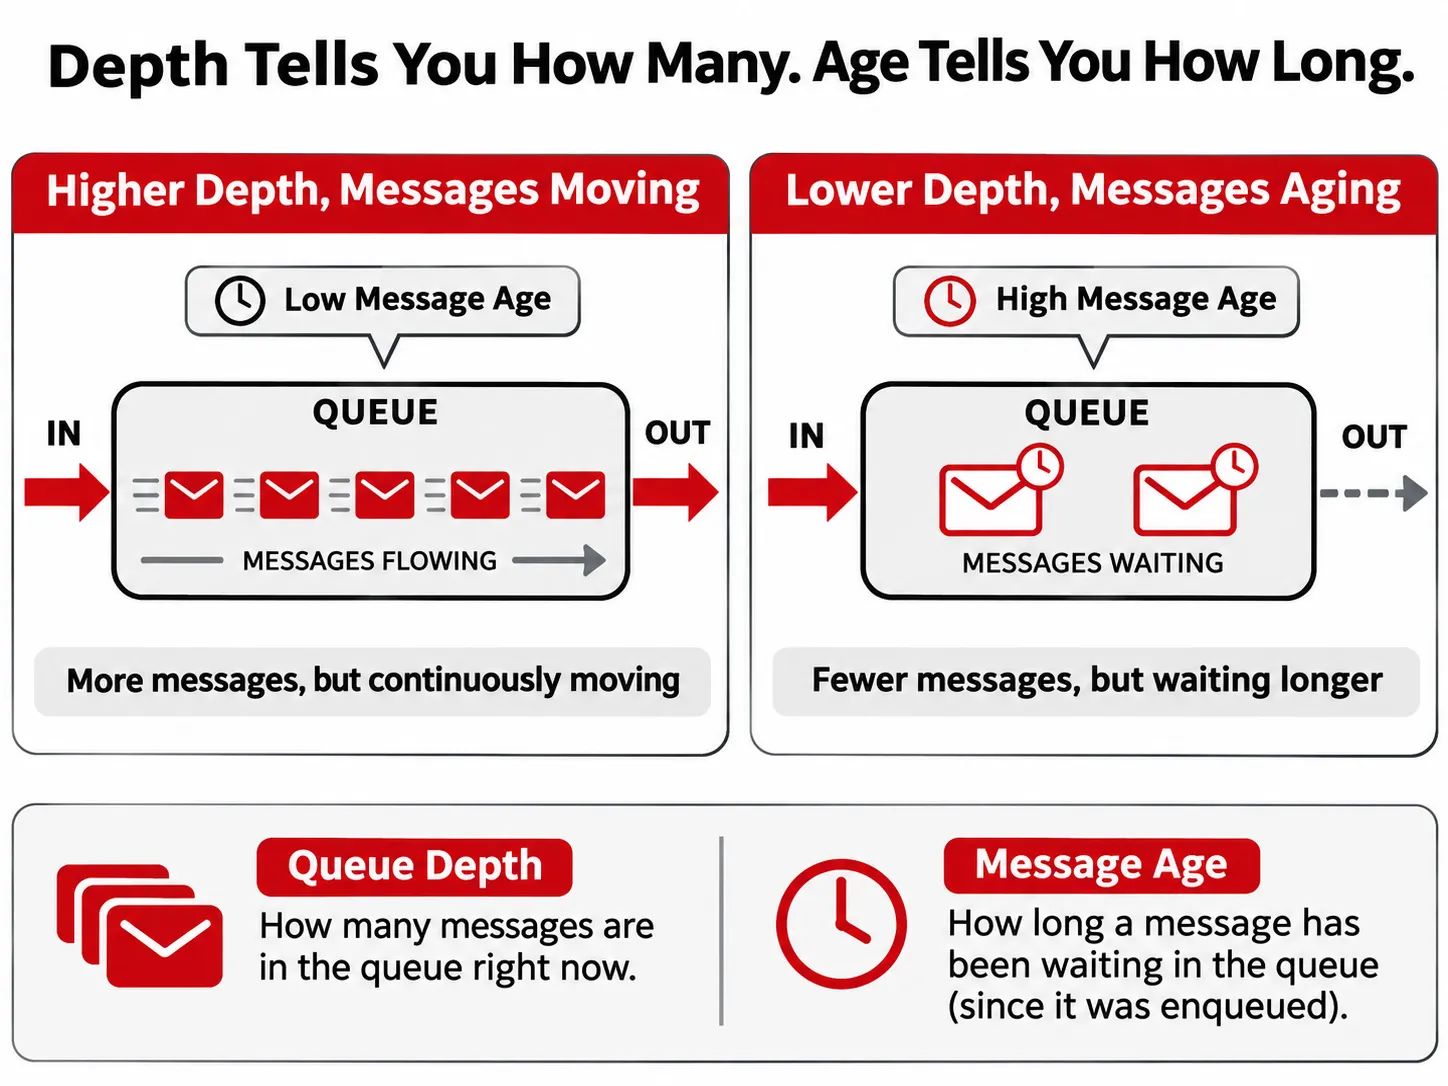
Queue depth tells you how many messages are waiting. Message age tells you how long they have been waiting.
That distinction can be important during an incident.
A queue with thousands of messages may be healthy if consumers are processing them at the expected rate. A queue with 30 messages may deserve immediate attention if payment messages normally clear within seconds and the oldest one has been sitting there for 10 minutes.
IBM MQ’s MSGAGE queue status value reports the age, in seconds, of the oldest message on a queue.[3]
Review message age alongside queue depth, input and output activity, and put and get rates. Together, those metrics give you a clearer picture of whether messages are flowing as expected or beginning to stall.
3. Monitor Message Flow Within MQ
A running queue manager is only one part of MQ health.
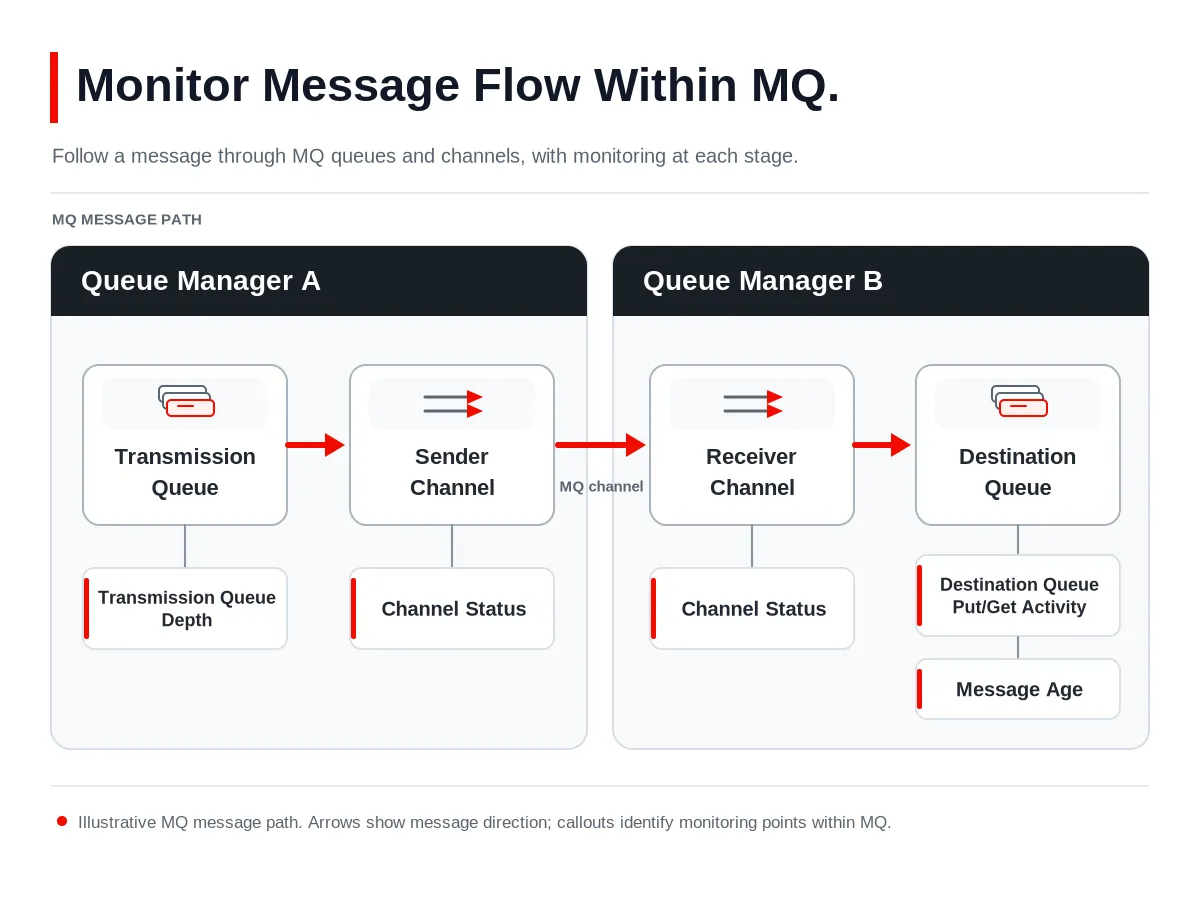
For payment messaging between queue managers, check the MQ components involved:
Transmission Queue → MQ Channels → Destination Queue
Watch Queues and Channels Together
Monitor queue manager availability, transmission queue depth, channel status, and activity on destination queues.
IBM MQ provides real-time monitoring information for both queues and channels, which helps teams evaluate the current state of individual MQ components.[2]
If payment messages build up on a transmission queue, check the associated channel status. If they reach the destination queue but remain there, review get activity and message age.
Reviewing these MQ conditions together helps teams narrow down where messages are accumulating.
4. Keep Dead-Letter Queues in View
Dead-letter queues should be part of regular operational monitoring.
Watch for new DLQ messages, increasing depth, repeated failures, reason codes, message source, and intended destination.
Finding messages on the DLQ is only the beginning of an investigation. Teams still need to determine why those messages landed there, whether the problem is isolated or recurring, and whether other transactions could be affected.
A growing DLQ can turn a routing, configuration, or application issue into a larger business problem if nobody notices it early.
5. Watch Certificates Before Expiration Becomes an Incident
TLS helps secure communication between IBM MQ queue managers and clients, and certificates are part of establishing those secure connections.[4]
That makes certificate status an operational concern as well as a security concern.
Track certificate expiration dates, certificates approaching renewal, their locations, and the MQ environments or connections that depend on them.
Certificate expiration is predictable. Giving the MQ team enough lead time to renew, test, and deploy certificates can help avoid an unexpected connectivity problem during a critical processing window.
6. Give Teams the MQ Visibility They Actually Need
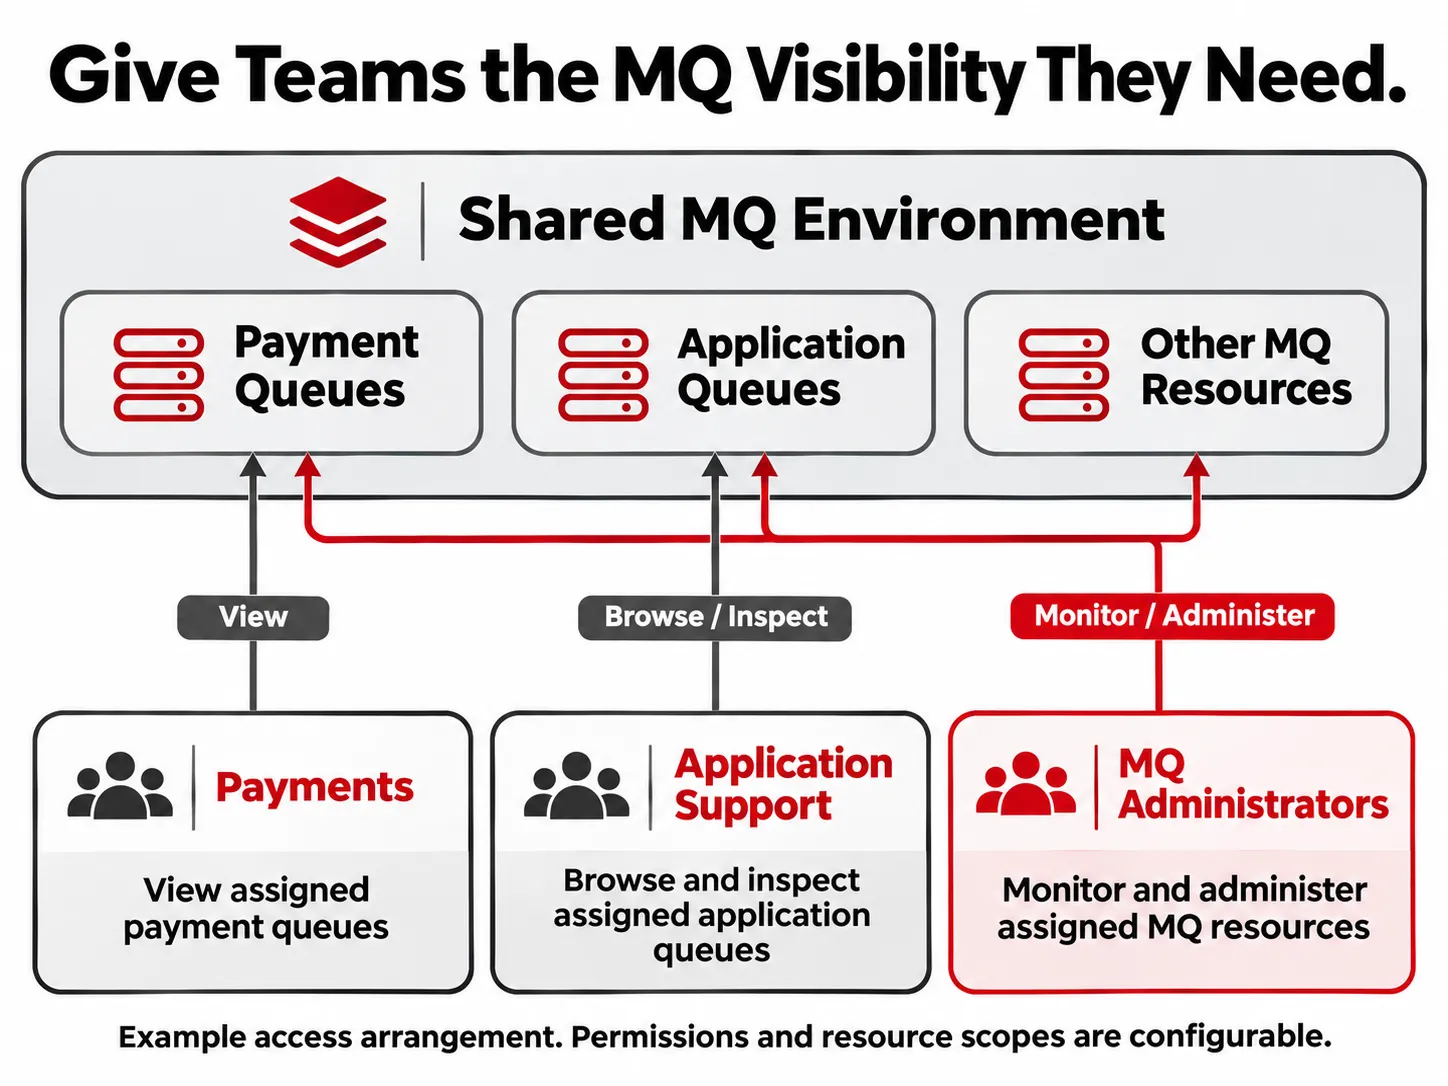
Payments, digital banking, fraud, application support, operations, and MQ administrators may all depend on the same MQ infrastructure.
They do not necessarily need the same level of access.
Keep Access Aligned With Responsibility
Application teams may need to inspect the queues and connections supporting their services without receiving broad administrative capabilities across the entire MQ estate.
That balance is particularly relevant in financial environments where access, monitoring, authentication, and encryption are tightly controlled. IBM’s banking reference architecture specifically calls out controls around access to network devices, monitoring remote access, strong authentication, and encryption.[1]
Giving teams visibility into the MQ resources they are responsible for can help them investigate issues faster while keeping administrative access aligned with their responsibilities.
7. Keep Historical Monitoring Data Available
Real-time alerts tell you what is happening now. Historical monitoring data helps explain how you got there.
Keep enough history to answer questions such as:
- When did this behavior begin?
- Has the same issue happened before?
- What did queue activity look like before the incident?
- Is throughput gradually increasing?
- How does today’s activity compare with previous periods?
- Is the environment beginning to approach a capacity limit?
IBM includes problem diagnosis, performance improvement, real-time statistics, audit trails, and capacity planning among the reasons for monitoring an MQ network.[5]
Historical data also makes your baselines more useful. Instead of deciding what “normal” should look like once, teams can continue refining that view as workloads and applications change
How Infrared360 Helps Monitor IBM MQ in Financial Services
Infrared360 brings several of these IBM MQ monitoring activities into one management portal.
Monitor and Alert on MQ Conditions
Infrared360 supports scheduled IBM MQ monitoring with configurable sampling intervals. Queue and channel alerts can include configurable conditions, delay periods, sleep schedules, priorities, notification actions, and notifications when an alert condition clears.
That gives teams more control over which conditions generate an alert and how those alerts are handled.
Test Message Flow and Keep Historical Statistics
Infrared360 Message Test Cases can create synthetic MQ messages to verify that applications accept expected messages, test routing through an MQ environment, and generate message volume for capacity planning.
The Audit Queue Manager service can collect endpoint statistics and retain them in the Infrared360 repository for later retrieval through reports, charts, or database queries.
Manage Visibility and Certificate Information
Infrared360 Roles define which IBM MQ functions users are permitted to perform, while Collections determine which resources and connections they can see. Connection filters can further limit which MQ objects are visible within a queue manager.
The Certificate Management screen also displays certificate information including certificate type, expiration date, subject, and keystore location.
Build MQ Monitoring Around Business Impact
Useful MQ monitoring eventually connects technical conditions to business impact.
“Queue depth exceeded 5,000” is a useful signal.
“Payment messages are accumulating because the downstream application is no longer consuming them at its normal rate” gives the team more context to act.
For financial services teams, that combination of visibility, context, and early detection can make MQ incidents faster to understand and easier to prioritize.
Frequently Asked Questions
What IBM MQ metrics should banks monitor?
Banks should monitor metrics that show both message flow and MQ infrastructure health. That can include queue depth, message age, put and get rates, throughput, channel status, queue manager health, consumers, readers and writers, and other application-specific conditions. The most useful thresholds should also reflect the normal behavior of each workload.
Is queue depth enough to monitor IBM MQ?
Queue depth is important, but it needs context. A high queue depth can be normal when messages are flowing quickly, while a relatively small queue can indicate a problem when messages have stopped moving. Message age, consumption rates, throughput, and normal workload patterns help show whether a queue is actually falling behind.
Why is message age important in IBM MQ monitoring?
Message age shows how long messages have remained on a queue. IBM MQ’s MSGAGE status value reports the age of the oldest message. This can reveal stalled or delayed processing even when queue depth remains relatively low, making it useful for workloads where messages are normally processed very quickly.
How can financial organizations give application teams access to MQ monitoring safely?
Access should be aligned with each team’s responsibilities. Application or support teams may need visibility into the queues and connections supporting their services without receiving unrestricted administrative access to unrelated MQ resources. Role-based permissions and scoped resource visibility can help organizations provide useful operational access while maintaining control.
How can synthetic transactions help monitor IBM MQ?
Synthetic transactions use known test messages to verify that an expected message path is actually working. Instead of looking only at the health of individual queues or channels, teams can test whether messages travel through the expected MQ route and whether the applications involved respond correctly.
Endnotes
[1] IBM Cloud, Banking application architecture for better agility, automation, and insights. IBM describes core banking and payment processing as high-volume, mission-critical workloads and identifies 24×7 availability, security, low latency, and high throughput as important banking requirements.
[2] IBM MQ Documentation, Real-time monitoring. IBM describes real-time queue and channel monitoring and its use for understanding the steady state of an MQ environment and diagnosing problems.
[3] IBM MQ Administration Reference, DISPLAY QSTATUS. IBM defines MSGAGE as the age, in seconds, of the oldest message on the queue.
[4] IBM MQ Documentation, Configuring TLS security for IBM MQ and Securing channels with TLS. IBM documents the use of certificates and TLS-enabled connections between queue managers and clients.
[5] IBM MQ Documentation, Monitoring your IBM MQ network. IBM lists problem detection and diagnosis, real-time statistics, audit trails, message activity, performance improvement, and capacity planning among the reasons for monitoring MQ.