On this page
When people think about IBM MQ capacity planning, queue depth is often one of the first things they look at.
That makes sense. If messages are piling up on a queue, something may not be keeping pace.
But queue depth only tells you part of the story.
An MQ environment can start running into capacity problems before a queue ever reaches an alarming depth. The real issue might be slower consumers, more application connections, changing channel activity, or pressure on the server running the queue manager.
Good IBM MQ capacity planning means looking at those signals together and understanding what “normal” looks like before something goes wrong.
What Does IBM MQ Capacity Planning Really Mean?
Capacity planning is about making sure your MQ environment can handle the work being asked of it today while leaving enough room for growth, peak traffic, and unexpected spikes.
That means looking beyond the maximum depth configured on a queue.
Useful questions include:
- How many messages are coming in and going out?
- Are messages spending longer on queues than they normally do?
- Are applications keeping up with the workload?
- Are channel connections increasing?
- Are CPU or memory resources getting tight?
- What happens during your busiest periods?
- Is today’s activity noticeably different from last month or last year?
IBM MQ provides real-time monitoring and statistics that help teams answer these questions. Historical monitoring is especially useful because a number by itself does not tell you whether it is normal for your environment.[1]
Queue Depth Is a Starting Point, Not the Whole Picture
Queue depth is still important. A growing queue can be an early sign that producers are sending messages faster than consumers can process them.
The important part is understanding why.
Imagine two queues that both contain 10,000 messages.
- For one application, that may happen every morning during a known processing window and clear within a few minutes.
- For another, the queue may normally contain fewer than 100 messages. Reaching 10,000 would be a major warning sign.
The number is the same. The situation is not.
That is why it helps to look at queue depth alongside other information such as:
- Enqueue and dequeue activity
- Message age
- Last GET and PUT activity
- Readers and writers
- Open queue handles
- Percentage of maximum queue depth
Infrared360 can monitor these MQ queue conditions and alert when the behavior moves outside the limits you define.
That gives an MQ team more context than simply waiting for a queue to cross one depth threshold.
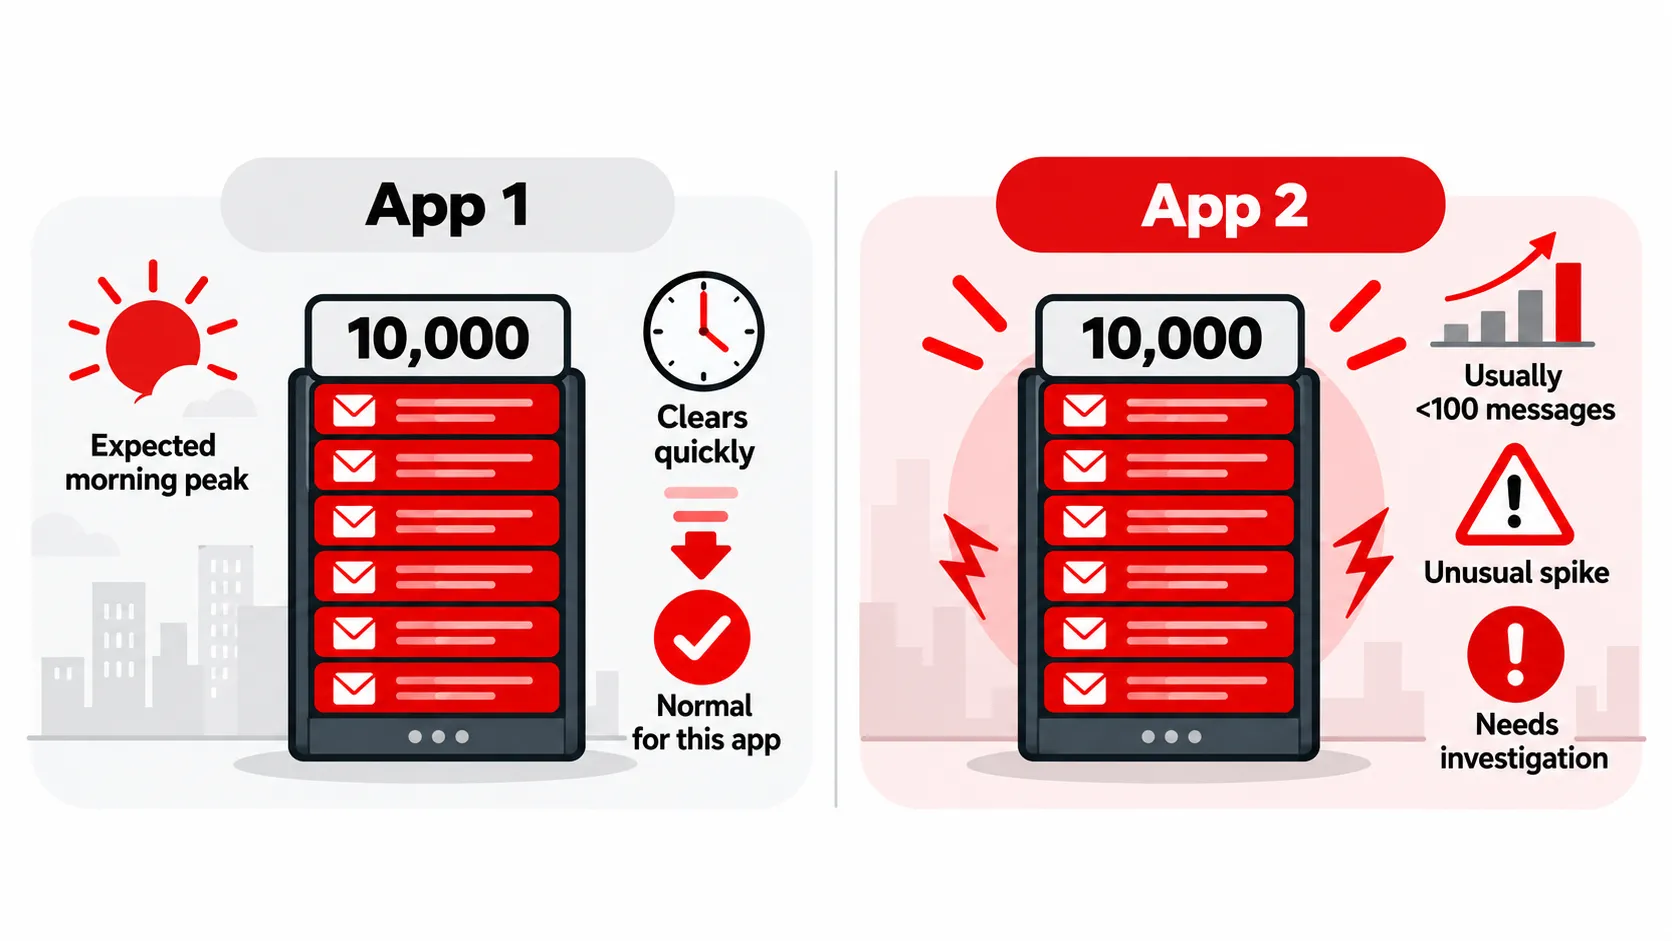
The same queue depth can mean very different things depending on what is normal for each application.
Compare Messages Coming In With Messages Going Out
One of the simplest ways to spot growing capacity pressure is to compare the rate at which messages enter a queue with the rate at which they leave.
If messages come in faster than they go out for a short period, that may be completely normal.
If that keeps happening, the backlog can continue to grow.
This is where historical information becomes useful.
IBM MQ can collect queue and channel statistics over time.[2] Infrared360 can collect and report on those statistics so teams can look for patterns instead of relying only on what is happening right now.
You may find that a queue always builds during a certain window and quickly recovers. Or you may see that the recovery period is getting longer each month.
That second pattern can be an early sign that you need more capacity.
Message Age Can Tell You Something Queue Depth Cannot
A queue does not have to be deep for messages to be delayed.
Suppose a queue contains only 50 messages. That may not look concerning.
But what if the oldest message has been sitting there far longer than normal?
That can tell you that the application consuming those messages is not keeping up, even though the queue itself is nowhere near full.
The opposite can also be true. A queue can contain thousands of messages and still be healthy if those messages are moving through quickly.
Looking at message age, queue depth, and throughput together gives you a much better sense of whether the environment is keeping up.
Channels and Connections Matter Too
Queues are only one part of MQ.
Applications connect through channels, and those connections also use resources.
IBM MQ provides settings such as MAXINST and MAXINSTC to limit the number of server-connection channel instances. These limits help prevent one application or workload from using all available connection capacity.[3]
For capacity planning, it is worth asking:
- How many channel instances are normal?
- Does that number increase during busy periods?
- Are channels unexpectedly moving into RETRYING or STOPPED states?
- Did a recent application change create more connections?
- Is one workload using more connection capacity than expected?
Infrared360 can monitor channel status and channel-instance conditions alongside queue activity.
This matters because connection pressure may appear before you see a major change in queue depth.
Remember the Server Underneath MQ
MQ still depends on the system it is running on.
CPU, memory, filesystem space, processes, and other operating-system resources can all affect how much work an MQ environment can handle.
That means an MQ capacity problem may not always look like an MQ problem at first.
If message traffic is increasing at the same time memory utilization is climbing or disk space is getting tight, those trends should be looked at together.
Infrared360 remote-host monitoring can track CPU, memory, filesystem space, and host availability alongside MQ conditions.
The goal is to understand whether the full environment has enough room to handle the workload—not simply whether the queue manager is running.
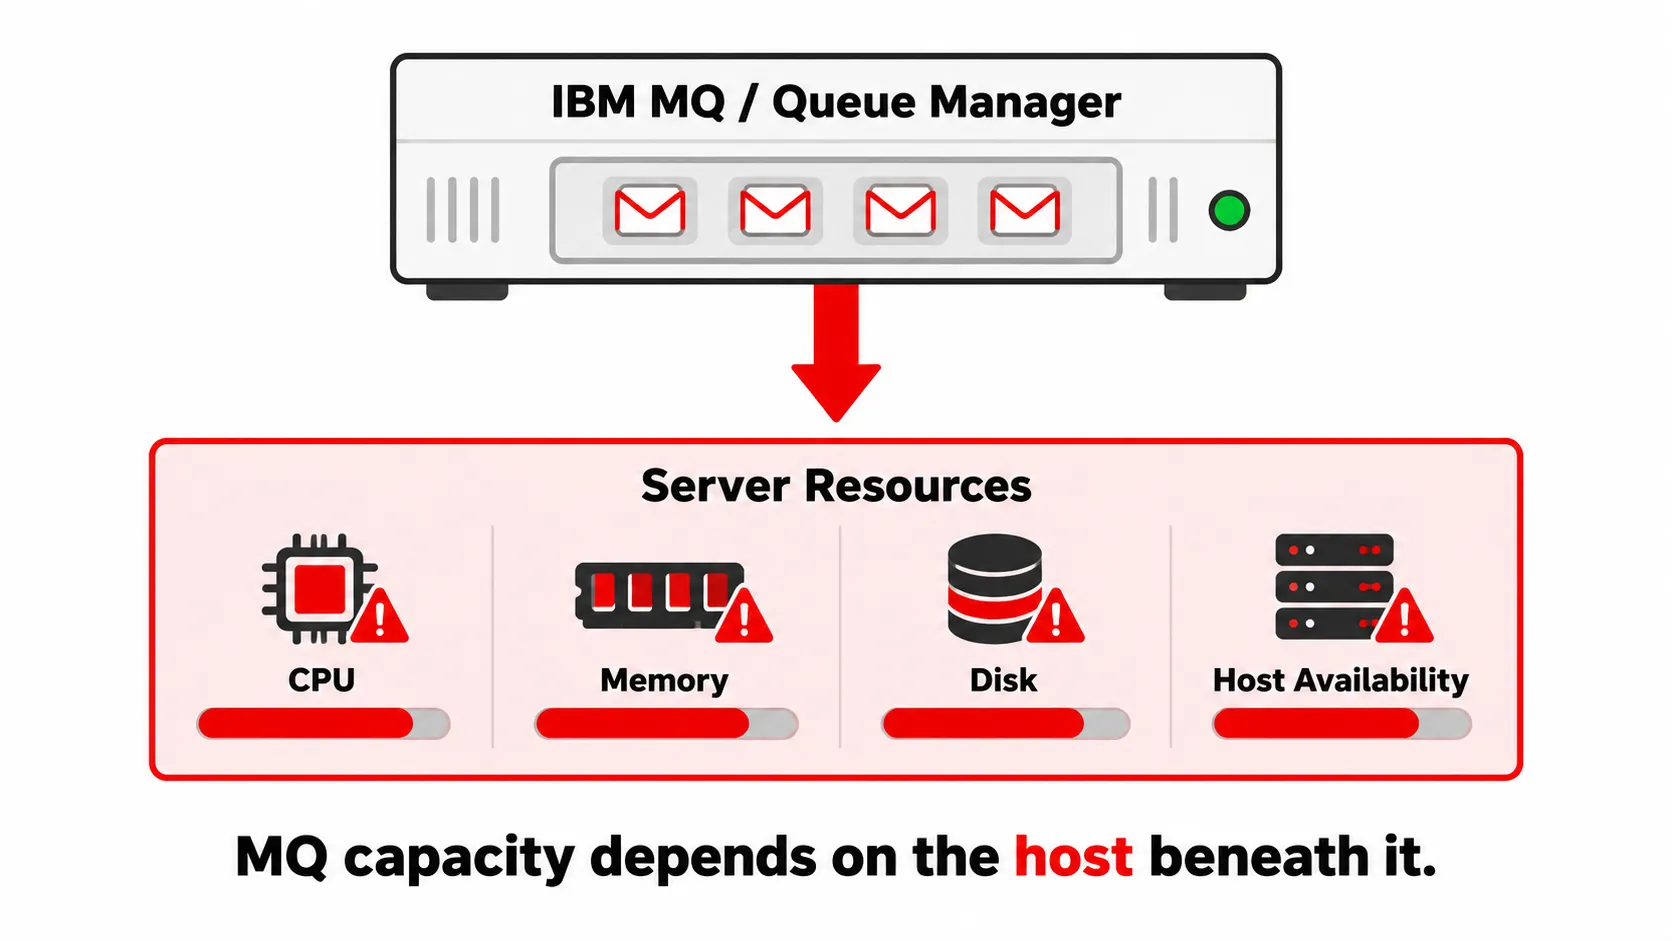
MQ capacity depends on the health and available resources of the server underneath it.
Build a Baseline Before You Need It
One of the hardest questions during an incident is:
“Is this actually unusual?”
That question is much easier to answer when you already know what normal looks like.
A useful MQ capacity baseline might include:
Typical and peak queue depths
- Normal enqueue and dequeue rates
- Expected message age
- Typical numbers of readers and writers
- Normal channel-instance counts
- Peak CPU and memory usage
- Daily, weekly, or seasonal traffic patterns
IBM notes that monitoring values become much more useful when administrators know their normal ranges and can spot changes over time.[1]
Infrared360 reporting and historical monitoring can help teams keep that information available instead of trying to reconstruct it after a problem begins.
Look Beyond a Single MQ Metric
There is no single number that tells you whether an IBM MQ environment has enough capacity.
Queue depth matters, but so do message age, throughput, consumers, channel activity, connections, and host resources.
The most useful capacity planning comes from looking at how those pieces work together and how they change over time.
With a good baseline and the right monitoring in place, MQ teams can spot growing pressure earlier, plan for changes with more confidence, and avoid waiting for a deep queue to be the first sign that something is wrong.
Infrared360 helps bring those MQ and infrastructure signals together so teams can see the bigger picture across their environment.
Frequently Asked Questions
What is IBM MQ capacity planning?
IBM MQ capacity planning is the process of making sure your queue managers, queues, channels, application connections, and supporting infrastructure can handle current and expected workloads.
Is queue depth enough for IBM MQ capacity planning?
No. Queue depth is useful, but it should be looked at alongside other information such as message age, enqueue and dequeue activity, channel connections, readers and writers, and host resources.
What IBM MQ metrics are useful for capacity planning?
Useful metrics can include queue depth, percentage of maximum depth, message age, enqueue and dequeue activity, last GET and PUT activity, queue handles, readers, writers, channel status, channel instances, CPU, memory, and filesystem usage.
Why are historical MQ metrics important?
Historical data helps you understand what is normal. That makes it easier to spot gradual changes, unusual workload patterns, and capacity problems before they become larger issues.
How often should IBM MQ capacity be reviewed?
Capacity should be reviewed regularly and whenever major application, infrastructure, or workload changes are planned. Ongoing monitoring can make capacity planning part of normal MQ operations instead of a one-time exercise.
Endnotes
- IBM Documentation, “Displaying queue and channel monitoring data.” IBM explains that MQ monitoring includes short- and long-term indicators and that understanding normal values helps administrators identify changes in queue-manager performance.
- IBM Documentation, “Queue Manager Properties.” IBM documents MQ queue, channel, and MQI statistics collection, including configurable statistics intervals for collecting activity data.
- IBM Documentation, “Server-connection channel limits.” IBM describes MAXINST and MAXINSTC and explains how these settings can help prevent applications from exhausting available server-connection channel capacity.