JBoss Performance Monitoring
Infrared360 JBoss performance monitoring and management gives you end-to-end observability of your JBoss Application Server as well as the applications deployed on it. Proactively monitor overall availability, health and performance, JVM usage and response time, CPU/memory usage, and more. Monitor performance of Java applications running on JBoss for full observability.
JBoss Monitoring for Your Entire Distributed Environment
Infrared360® is cloud native and designed to give you observability across your entire modern distributed environment. Monitor JBoss Application Servers on-prem, in the cloud, in containers, across multi-cloud – anywhere. With Infrared360® you get end-to-end observability of 100s of application servers (including JBoss and Tomcat – plus other infrastructure) all under one interface.
Proactively Monitor JBoss KPIs in True Real-Time™
Other JBoss performance monitoring solutions write to logs and then, reactively monitor and fire alerts based off averages in that data. This can create long lags before you’re notified about an incident. This can lead to long hours forensically deciphering what went wrong and when. Infrared360 facilitates a proactive management approach with True Real-Time Monitoring™ and insightful analytics tools. Plus, you get powerful drag-and-drop visualizations for your historic data too.
Monitor JBoss Application Server performance metrics in True Real-Time™ :
JVM metrics
System status
JDBC Connection metrics
Thread Pool data
Web Application metrics
Dynamic cache
JCA connection
EJB Methods
EJB stats
(to name a few)
Head-Off Issues with Automated Corrective Actions
Infrared360 JBoss Performance Monitoring lets you use True Real-Time™ Alerts to facilitate automated corrective action before end users are affected. Trigger services or your custom scripts to automate responses such as changes to database connection pool size or restarting a JBoss server when its memory usage reaches a determined threshold
Get Ahead of Memory Leaks and Out of Memory Exceptions
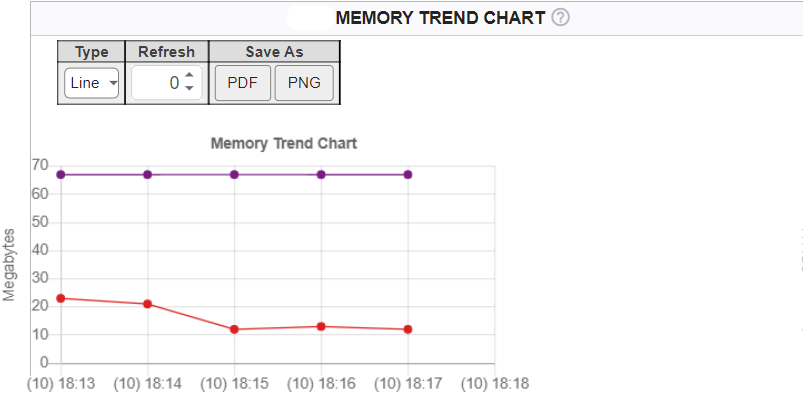
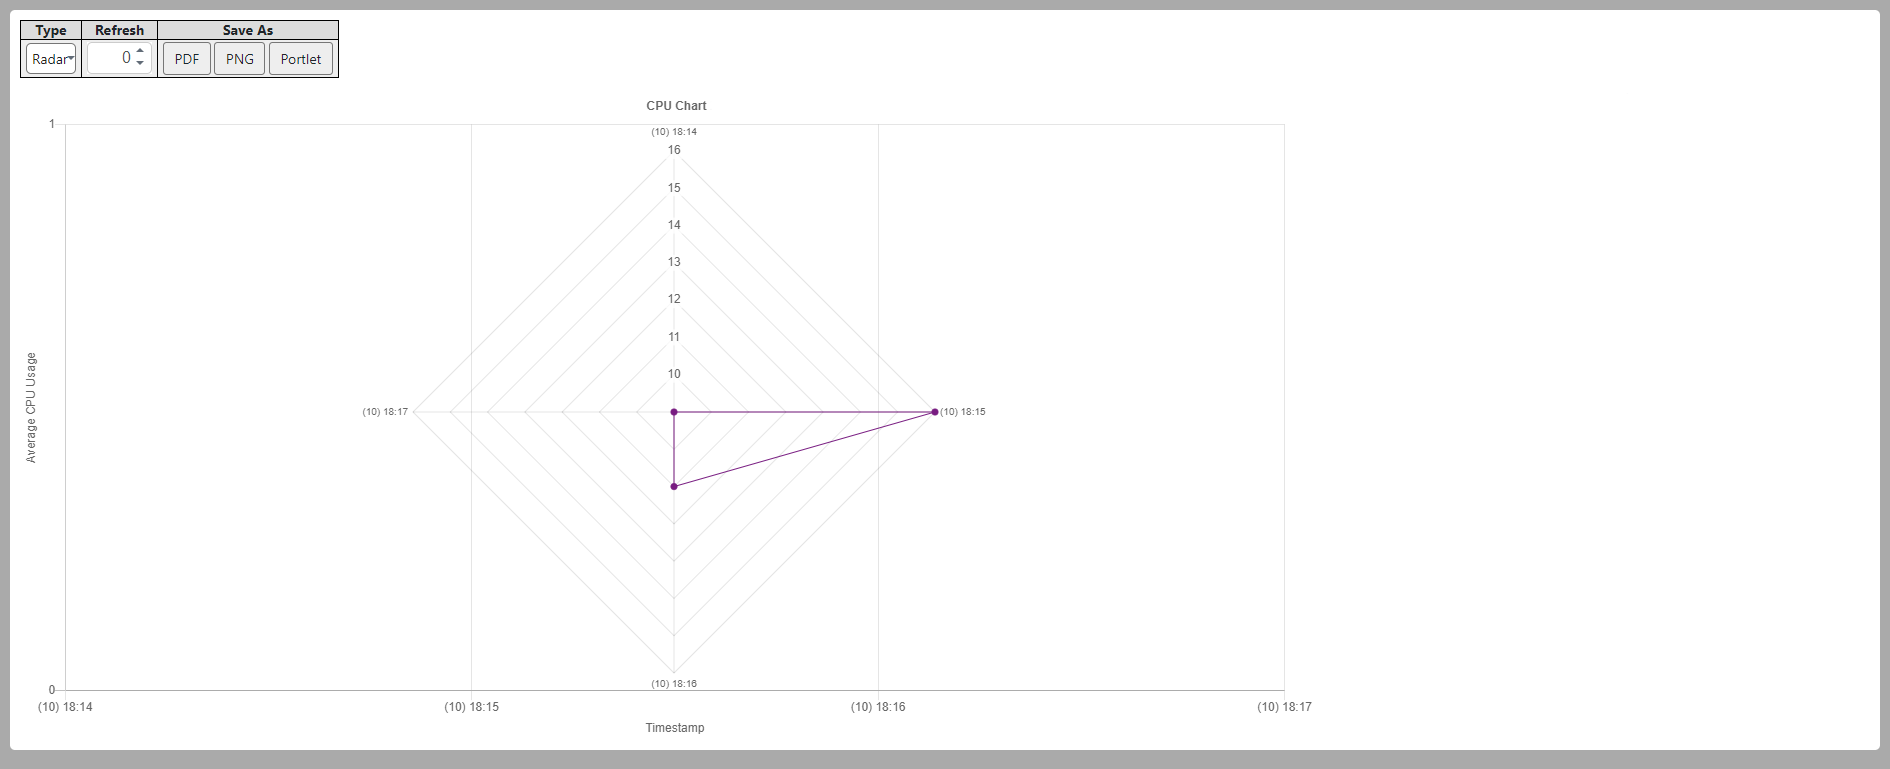
Utilize True Real-Time™ JBoss performance monitoring to avoid costly downtimes in production and deployment schedule creep. Get True Real Time Alerts™ on JVM Memory and CPU metrics as well as full historic data visualizations on usage over-time.

Prevent Performance Deterioration and Java Application Freeze
Proactively monitor and alert on JDBC Connection Pool usage, thread pool utilization, and Dynamic Cache. With Infrared360®, set thresholds to head-off problems, and use our True Real Time Alerts™, and Trusted Spaces™ features to delegate administration for secure, collaborative corrective action.
Improve Capacity Planning for Your Entire Distributed Environment
Get a better handle on capacity planning with accurate stats for JBoss active sessions, EJB throughput, and the JMS queue depth of web applications. Infrared360 JBoss Performance Monitoring gives you detailed analytics in real-time and historically.
Optimize Server Cluster Performance
Ensure performance and high availability of your server clusters. Infrared360 monitors the Workload Manager and WLM Client confirming that CPU utilization is distributed across clustered servers.

View Performance in an On-Going Perspective and Bulletproof Your Production Environment with DevOps Monitoring

With no deployment of agents, scripts, or clients, DevOps monitoring is a snap with Infrared360. Take an active approach to monitoring your application servers, applications, website, APIs, and or other element of your distributed infrastructure in prod AND pre-prod. Infrared360 is ideal for pre-production since the lack of scripts and agents ensures updates or changes in pre-production don’t break the monitor in production. This means you can maintain monitoring continuity for your agile teams and DevOps initiatives without the fear that iterative improvements will be halted by a bottleneck monitor. Ensuring that test teams and operations teams are in alignment about what and how they are monitoring is vital to sustaining visibility into application health.
- No backtracking to rectify false alerts and blind spots
- No wasting time and resources fixing an issue that could have been avoided earlier in the development lifecycle.
- Help Dev become Ops literate
- Familiarize your teams with what KPIs should look like in Prod
- Foster continuous deployment
Infrared360 is designed to
Reduce your JBoss TCO
- Manage 3 times as many servers with 20% less manpower
- Reduce Incident reports by more than 70%
- Improve server uptime to 99%
- Eliminate major outages
- No agents, no scripts, and no clients to install or update
- Eliminates user provisioning
- Installs in less than 15 minutes
- Reduce time to resolution by 90%
- Proactive monitoring and management save hours of time/manpower
- Fosters Self-healing to save on time to resolution
- Reduces Help-desk and ticket system costs by fostering Smart, Secure Self-Service
Improve Security
- Trusted Spaces™ lets you limit user access and visibility to only those objects they are permitted to and lets you delegate administration based on roles, location, teams, products, or anything else you need to. This maintains a secure environment yet still fosters Secure collaborative problem resolution
- User and Change audit trails are fully baked-in
- No agents, scripts, or clients means fewer vulnerability points across distributed environments
- Comply with your Corporate Security Model
- Limit time spent on installations and configurations
- Limit rogue tools (no audit, security, delegation)
- Limit direct User access to managed servers
- Limit updates to servers/tables/files for all permutations of access rights
- Limit storage of corporate assets on desktops
- Provide a secure, collaborative problem-solving environment
- True Real-Time™ Monitoring and Alerting to keep ahead of suspicious activity
Manage Proactively
- True Real-time Analytics (plus Drag & Drop Historic Data Visualizations
- Easily set thresholds, alerts, and notifications to prevent rather than forensically examine
Provide Graphical Insight and Sharable Reporting
Alert types:
- TCP/IP Connections to JBoss Application Servers;JBoss Application Server Status (started/stopped) - Users can start/stop/resume applications
- JBoss Enterprise Applications (started/stopped) – for each application within the server - Users can start/stop/resume applications if permitted
- Application Thread Pool (count/percent) – for each application within the server.
Chart types:
- System info
- Server Memory
- Application Server Statistics (e.g. thread pool, etc.)
Report types:
- JBoss Application Server Status: start/stop dates/times of server, memory info, cell, node, version, platform, status.
- Enterprise Applications status for each application within the server; start/stop date/times.
- PMI statistics
Click here to schedule a no obligation info session with one of our monitoring experts and learn how you can see a Free Live Demo of INFRARED360 in action on a real network.


